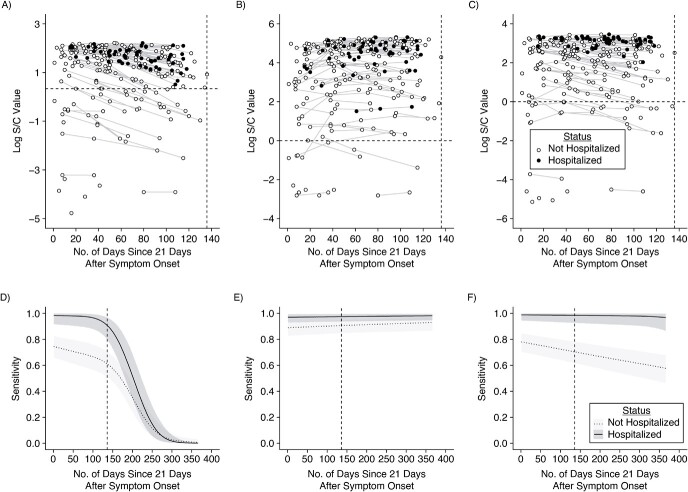
Figure 2.
Longitudinal severe acute respiratory syndrome coronavirus 2 (SARS-CoV-2) antibody kinetics and estimated assay sensitivities according to time and hospitalization status. Days since symptom onset (offset by 21 days) is shown on the x-axis versus the log-transformed antibody response for each of the Abbott (Abbott Park, Illinois) ARCHITECT (A), Roche (Indianapolis, Indiana) Elecsys (B), and Ortho (Raritan, New Jersey) VITROS IgG (C) assays, stratified by hospitalization status (empty circle indicates nonhospitalized; filled circle indicates hospitalized). For asymptomatic individuals, the time since the first positive PCR test (offset by 21 days) was used. This time metric is referred to as “time since seroconversion” hereafter. Longitudinal samples are connected by thin lines. The dashed horizontal line indicates the cutoff value for positivity on that assay. The dashed vertical line indicates the maximum observed time (x = 136 days). The key is shared across panels A–C. Estimated sensitivity for each of the Abbott ARCHITECT (D), Roche Elecsys (E), and Ortho VITROS IgG (F) assays (showing posterior median estimates and 95% credible intervals), stratified by hospitalization status (light gray with dotted line indicates nonhospitalized; dark gray with solid line indicates hospitalized), from 0 to 365 days after seroconversion. The key is shared across panels D–F. S/C, signal-to-cutoff value.

