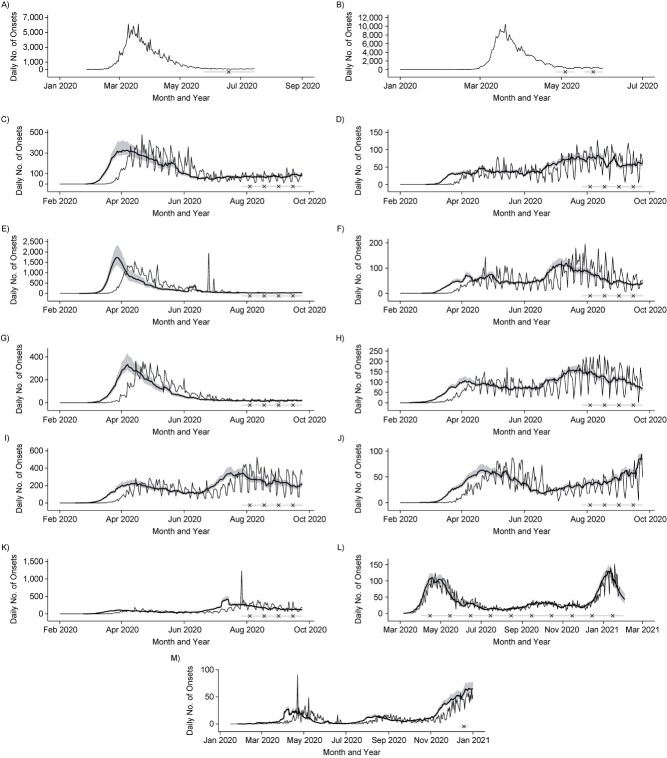
Figure 3.
Reported epidemic time series from serosurvey locales, reconstructed symptom onsets, and serosurvey timing. Serosurvey dates are shown by the light gray bar (range) and black × symbol (midpoint) on the bottom of each panel. For reconstructed symptom onset curves, reported data are shown as the thin curve, and posterior median estimates and 95% credible intervals are shown in the thick curve and shaded regions. A) Reported daily symptom onsets in Italy, January to July 2020. B) Reported daily symptom onsets in Spain, January to June 2020. Daily symptom onsets by census division in the United States, reconstructed from death reports, February to September 2020, according to census division: C) East North Central, D) East South Central, E) Middle Atlantic, F) Mountain, G) New England, H) Pacific, I) South Atlantic and Puerto Rico, J) West North Central, and K) West South Central. L) Daily symptom onsets in Manaus, Brazil, reconstructed from hospitalization reports, March 2020 to January 2021. M) Daily symptom onsets in Japan, reconstructed from death reports, January to December 2020. Reconstructed symptom onsets from death reports precede deaths by approximately 3 weeks, while reconstructed symptom onsets from hospitalization reports precede hospitalizations by approximately 10 days.

