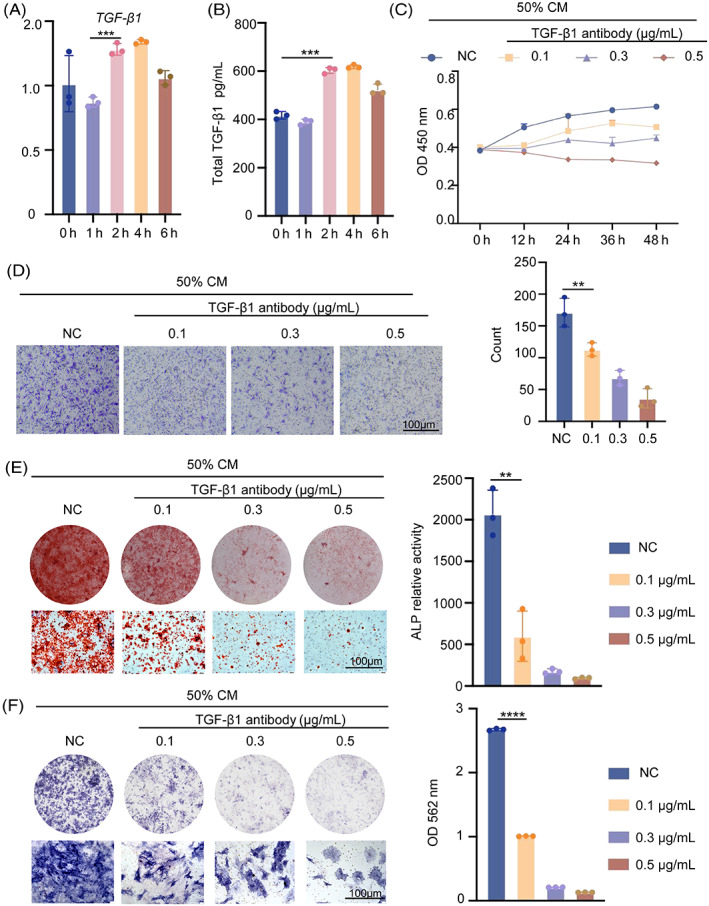
FIGURE 6.

M2 macrophages promote the osteogenic differentiation of BMSCs by secreting TGF‐β1. (A) TGF‐β1 in RAW264.7 cells was measured by real‐time RT‐PCR. GAPDH was used for normalization. (B) TGF‐β1 secretion from macrophages under various stress situations is measured using an ELISA. (C) Cell Counting Kit 8 (CCK8) was used to investigate BMSCs proliferation after treatment with various concentrations of TGF‐β1 antibody. (D) TGF‐β1 antibody effects on BMSC vertical migration, as indicated by four micrographs of BMSCs in separate groups at the bottom of the migration transwell culture chamber. (E) BMSCs treated with TGF‐β1 antibody were stimulated into osteogenesis in osteogenic differentiation medium. The ALP staining approach was used in BMSCs. The top photos are gross scanning images (scale bar: 160 μm), whereas the bottom images are expanded images (magnification: 250, scale bar: 160 μm). (F) The osteogenic differentiation of BMSCs was assessed by Alizarin Red staining after 21 days. The photos on top are gross scanning images (scale bar: 160 mm), while the images on the bottom are expanded images (magnification: ×250, scale bar: 160 μm). Data represent the mean ± SD. *p < 0.05, **p < 0.01, ***p < 0.001.
