FIGURE 4.

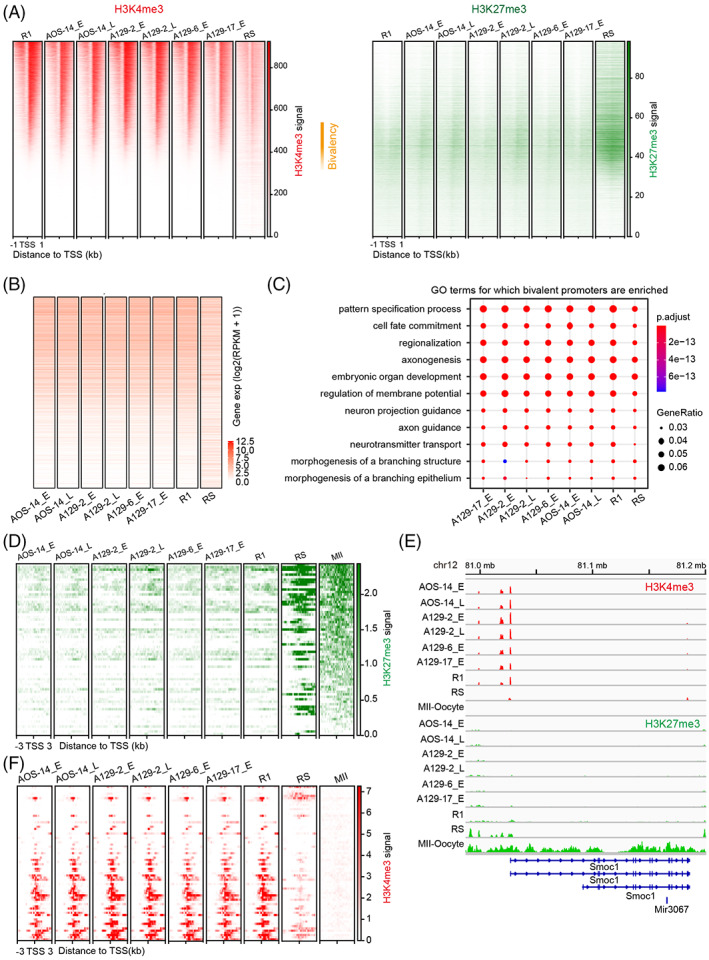
The H3K4me3 and H3K27me3 landscape in promoters is similar between androgenetic haploid embryonic stem cells (AG‐haESCs) and ESCs. (A) Heatmaps showing H3K4me3 (left) and H3K27me3 (right) signals around the 1 kb regions flanking the transcriptional start site (TSS). The regions are ordered by H3K4me3 signal levels in ESC R1. The regions in other cell types are in the same order as that for R1. H3K27me3 signals are plotted in the regions in the same order as that for H3K4me3. Bivalency indicates the regions containing both H3K4me3 and H3K27me3 in ESC R1 and AG‐haESCs. (B) Expression levels of the genes in the same order as that in (A). (C) Functional annotation of the bivalent genes in AG‐haESCs in (A). (D) H3K27me3 signals around 3 kb regions of the maternal H3K27me3‐imprinted genes in the same order as that in Figure 1D.(E) Browser view of H3K27me3 signals in the representative maternal H3K27me3‐imprinted gene Smoc1. (F) H3K4me3 signals around 3‐kb regions of the maternal H3K27me3‐imprinted genes in the same order as that in Figure 1D.
