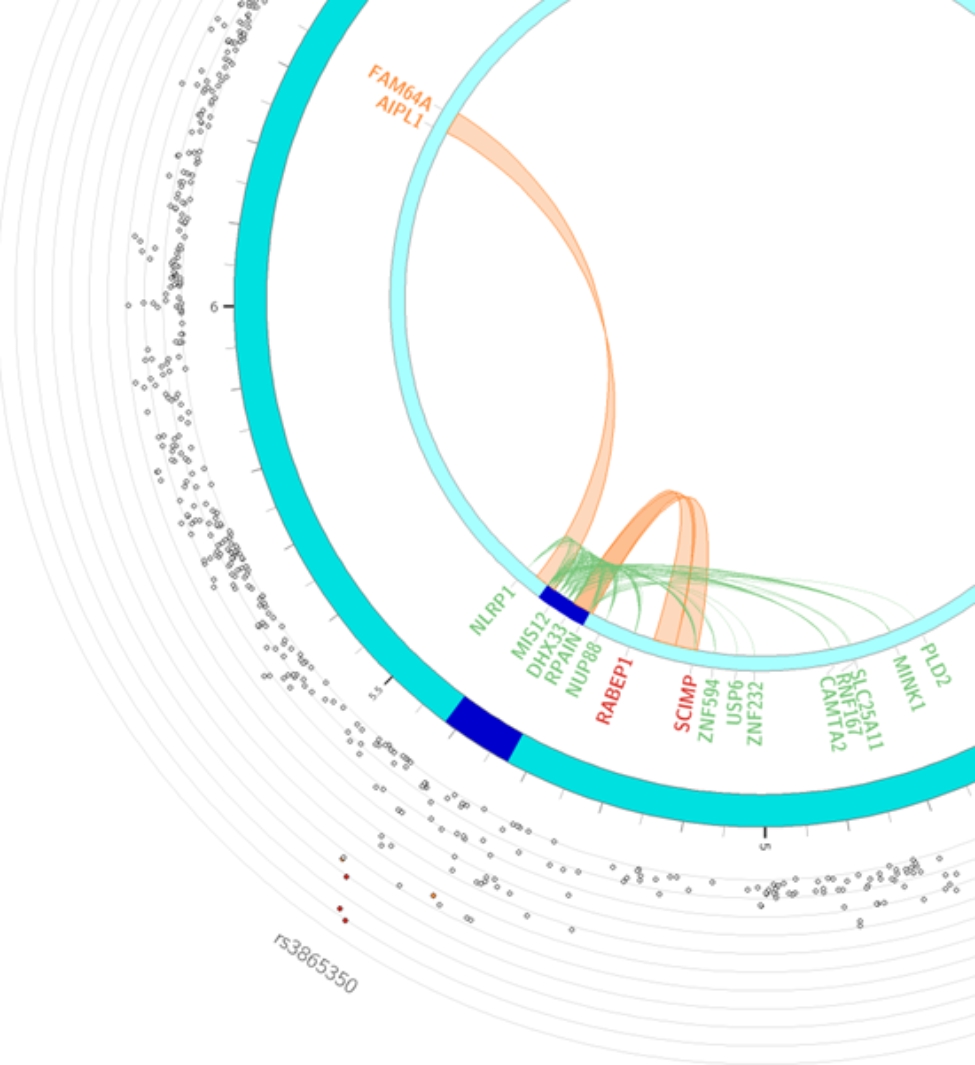
Fig. 2.

Circos plot for rs3865350 highlighting eQTLs and/or chromatin interactions. The circos plot was generated via FUMA [43] v1.3.4b (https://fuma.ctglab.nl/), the outer most layer is Manhattan plot and the middle layer highlights genomic risk loci (as defined by FUMA [43] using minimum P-value of lead SNPs of 1 × 10− 5 and default values for other parameters) in blue, while the inner most layer highlights eQTLs and/or chromatin interactions. Only SNPs with p < 0.05 are displayed in the outer ring. SNPs in genomic risk loci are color-coded as a function of their maximum r [2] to the one of the independent significant SNPs in the locus. The rsID of the top SNPs in each risk locus are displayed in the most outer layer. For the inner most layer, if the gene is mapped only by chromatin interactions or only by eQTLs, it is colored orange or green, respectively. It is colored red when the gene is mapped by both
