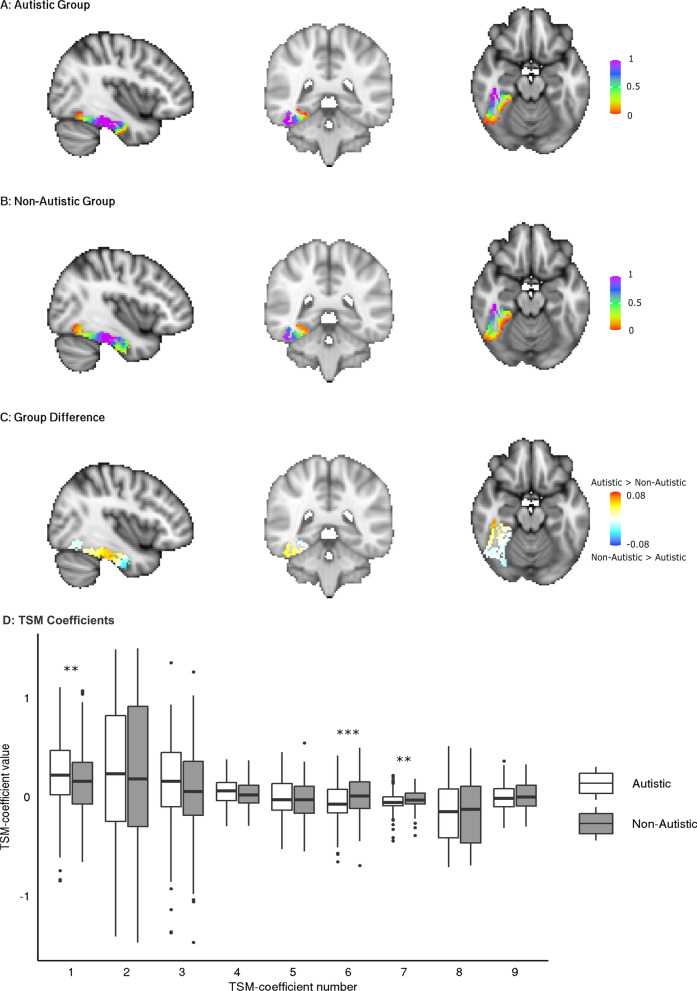
Fig. 4.
Group average connectopic maps of the right fusiform gradient 2 and TSM coefficients per group. A Shows the average gradient of the autistic group. B Shows the average gradient of the non-autistic group. The colour scale represents the similarity of functional connectivity between voxels and the rest of the brain, with similar colours representing a similar connectivity pattern. C Is the group difference map. Red indicates where the autistic group had higher connectivity gradient values compared to the non-autistic group. Blue indicates the opposite—where the autistic group had lower connectivity gradient values compared to the non-autistic group. D Shows the values of TSM-Coefficients as boxplots showing the first and third quartile with the median denoted with a thick horizontal line. The plots are split by group. Coefficients that are significantly different between groups post-MCC are denoted with asterisks. **padj ≤ 0.01, ***padj ≤ 0.001

