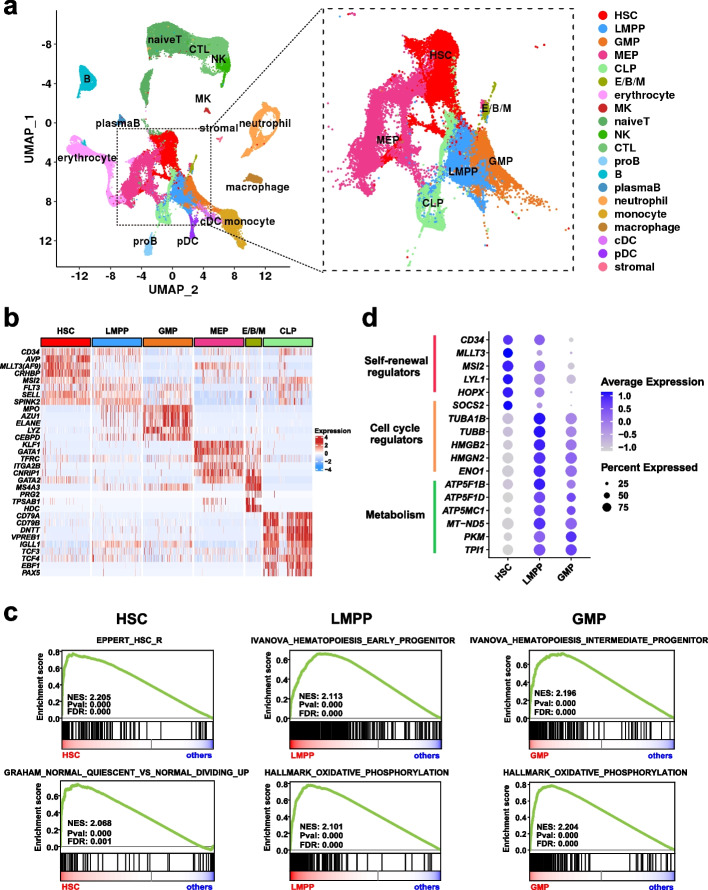
Fig. 1.
Single-cell transcriptome landscape of human normal hematopoiesis. a UMAP visualization of healthy human hematopoietic cells (n = 155,574 cells), with each dot representing a cell and colors indicating distinct cell types. The inset plot provides an enlarged view of the six HSPC clusters, including HSC (hematopoietic stem cell), LMPP (lymphoid-primed multi-potential progenitor), GMP (granulocyte–macrophage progenitor), CLP (common lymphoid progenitor), MEP (megakaryocyte (MK) and erythroid progenitor), and E/B/M (eosinophil/basophil/mast cell progenitor) that express three lineages-specific canonical markers and MEP commitment-essential transcription factors, consistent with previous reports [14–17]. b Heatmap illustrating cell type-specific gene expression (rows) across various HSPC populations (columns). c GSEA plots showing the representative gene signatures enriched in HSC, LMPP, and GMP populations with accompanying normalized enrichment score (NES), p value, and false discovery rate (FDR) value. d Dot plot representing the expression of representative genes involved in indicated biological processes in HSC, LMPP, and GMP populations. Dot size signifies the proportion of cells expressing a gene in a cell population, while shading represents the relative expression level

