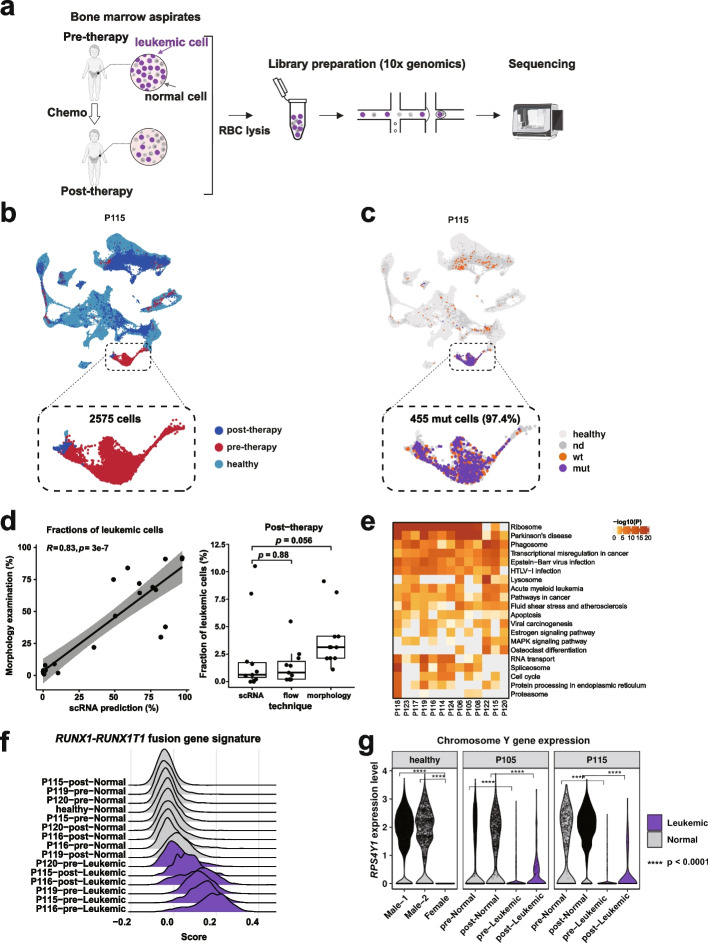
Fig. 2.
Identification and validation of AML cells in pre- and post-chemotherapy whole bone marrow samples. a Workflow illustrating the collection and processing of BM aspirates from 13 pediatric AML patients for scRNA-seq analysis. b UMAP shows the clustering of healthy donors (n = 155,574 cells) with paired pre- and post-therapy samples from patient P115 (n = 18,257 cells). Cells are color-coded by sample origin. The inset plot provides an enlarged view of leukemia clusters, with the predicted leukemic cell count indicated. c UMAP visualization as in panel b, with cells colored based on detected mutant (purple) or wild-type (orange) transcripts. The number of mutant cells is indicated, and the percentage of mutant cells assigned to predicted leukemia cells is noted in parentheses. d (Left) Scatterplot comparing the proportions of predicted malignant cells determined by morphology and scRNA-seq, with correlation coefficient (R) and p values calculated using Pearson’s correlation test. (Right) Boxplot comparing the proportions of post-therapy malignant cells determined by scRNA-seq, morphology, and flow cytometry, with each point representing a sample and p values calculated using the Wilcoxon signed-rank test. e Heatmap displays KEGG pathways enriched by highly expressed genes in leukemic cells within each AML patient. f Ridge plots showing the expression of RUNX1-RUNX1T1 fusion gene signature in leukemic and normal cells from four patients (P115, P116, P119, and P120) harboring this chromosomal translocation. g Violin plots depicting the expression of Y chromosome-located gene RPS4Y1 in cells from healthy female and male donors, as well as in predicted leukemic and normal cells pre- and post-chemotherapy from two patients (P105 and P115) with a chromosome Y deletion. P values were calculated using the Wilcoxon signed-rank test

