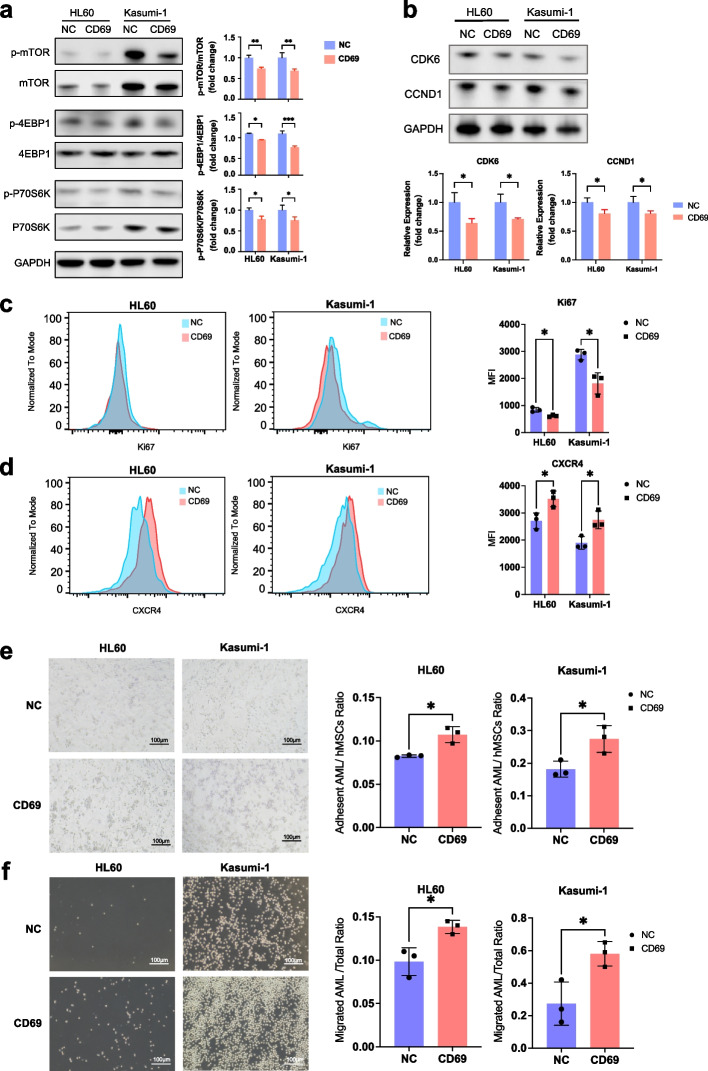
Fig. 6.
CD69 overexpression inhibits the mTOR pathway and enhances AML cell adhesion and migration. a (Left) Western blot showing total and phosphorylated protein levels of mTOR, 4EBP1, and P70S6K in negative control (NC) and CD69-overexpressing HL60 and Kasumi-1 cells. (Right) Bar plots displaying relative quantification by densitometry. b (Top) Western blot showing total protein levels of CDK6 and CCND1 in NC and CD69-overexpressing HL60 and Kasumi-1 cells. (Bottom) Bar plots displaying relative quantification by densitometry. c Representative histograms (left) and corresponding statistical results (right) of flow cytometry analyses showing protein levels of the classic proliferation marker Ki67 in NC and CD69-overexpressing HL60 and Kasumi-1 cells. d Representative histograms (left) and corresponding statistical results (right) of flow cytometry analyses showing protein levels of surface chemokine receptor CXCR4 on NC and CD69-overexpressing HL60 and Kasumi-1 cells. e Representative images (left) and corresponding statistical results (right) showing adhesion capacity of NC and CD69-overexpressing HL60 and Kasumi-1 cells to hMSCs. f Representative images (left) and corresponding statistical results (right) showing migration of NC and CD69-overexpressing HL60 and Kasumi-1 cells toward CXCL12 and S1P respectively. * p < 0.05; **p < 0.01; ***p < 0.001; ns, not significant; t test. Mean ± SEM values are shown for panels a, c-f

