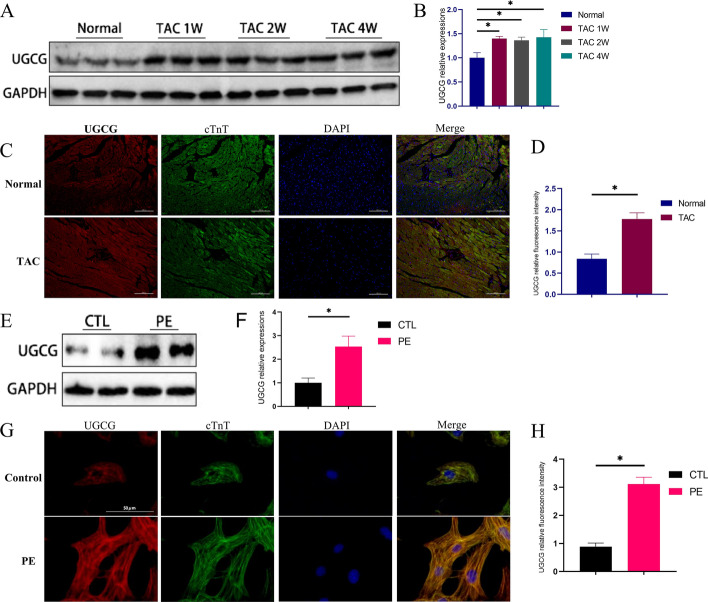
Fig. 1.
UGCG expression is increased in the pressure overload heart. A, B Western blot assays showed the expression level of UGCG at different time points and corresponding statistical analysis histogram. C, D Immunofluorescence staining showed the expression of UGCG in different heart groups and corresponding statistical analysis diagrams. E, F Western blot assays showed the expression level of UGCG in primary cardiomyocytes in vitro and corresponding statistical analysis histogram. G, H Immunofluorescence staining showed the expression of UGCG in primary cardiomyocytes in vitro and corresponding statistical analysis histogram. N = 6, *p < 0.05. UGCG: UDP-glucose ceramide glycosyltransferase; TAC: Transverse aortic constriction; PE: Phenylephrine

