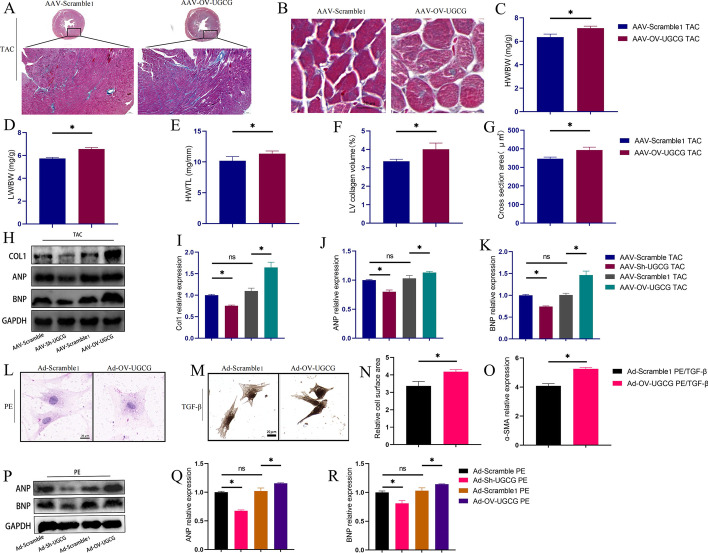
Fig. 4.
Overexpression of UGCG aggravated heart remodeling. A, F Masson staining showed the overall degree of myocardial hypertrophy and fibrosis (N = 5). B, G The representative pictures of the size of the cross-sectional area of cardiomyocytes in the heart and corresponding statistical analysis histogram (N = 5). C–E Statistical charts of HW/BW, LW/BW, and HW/TL in different groups (N = 5). H–K Western blot results of Col1, ANP, and BNP expression levels in hearts from different groups (N = 3). L, N HE staining showed the cell surface area of cardiomyocytes from different groups (N = 6). M, O Immunohistochemical images of α-SMA staining in heart fibroblasts from different groups (N = 6). P–R Western blot results of ANP, BNP expression levels in cardiomyocytes from different groups (N = 3). *p < 0.05, ns: No significance. AAV-Scramble1: Negative control of AAV-OV-UGCG; Ad-Scramble1: Negative control of Ad-OV-UGCG; HW/BW: Heart weight/body weight; LW/BW: Left ventricle weight/body weight; HW/TL: Heart weight/tibia length; LV: Left ventricle

