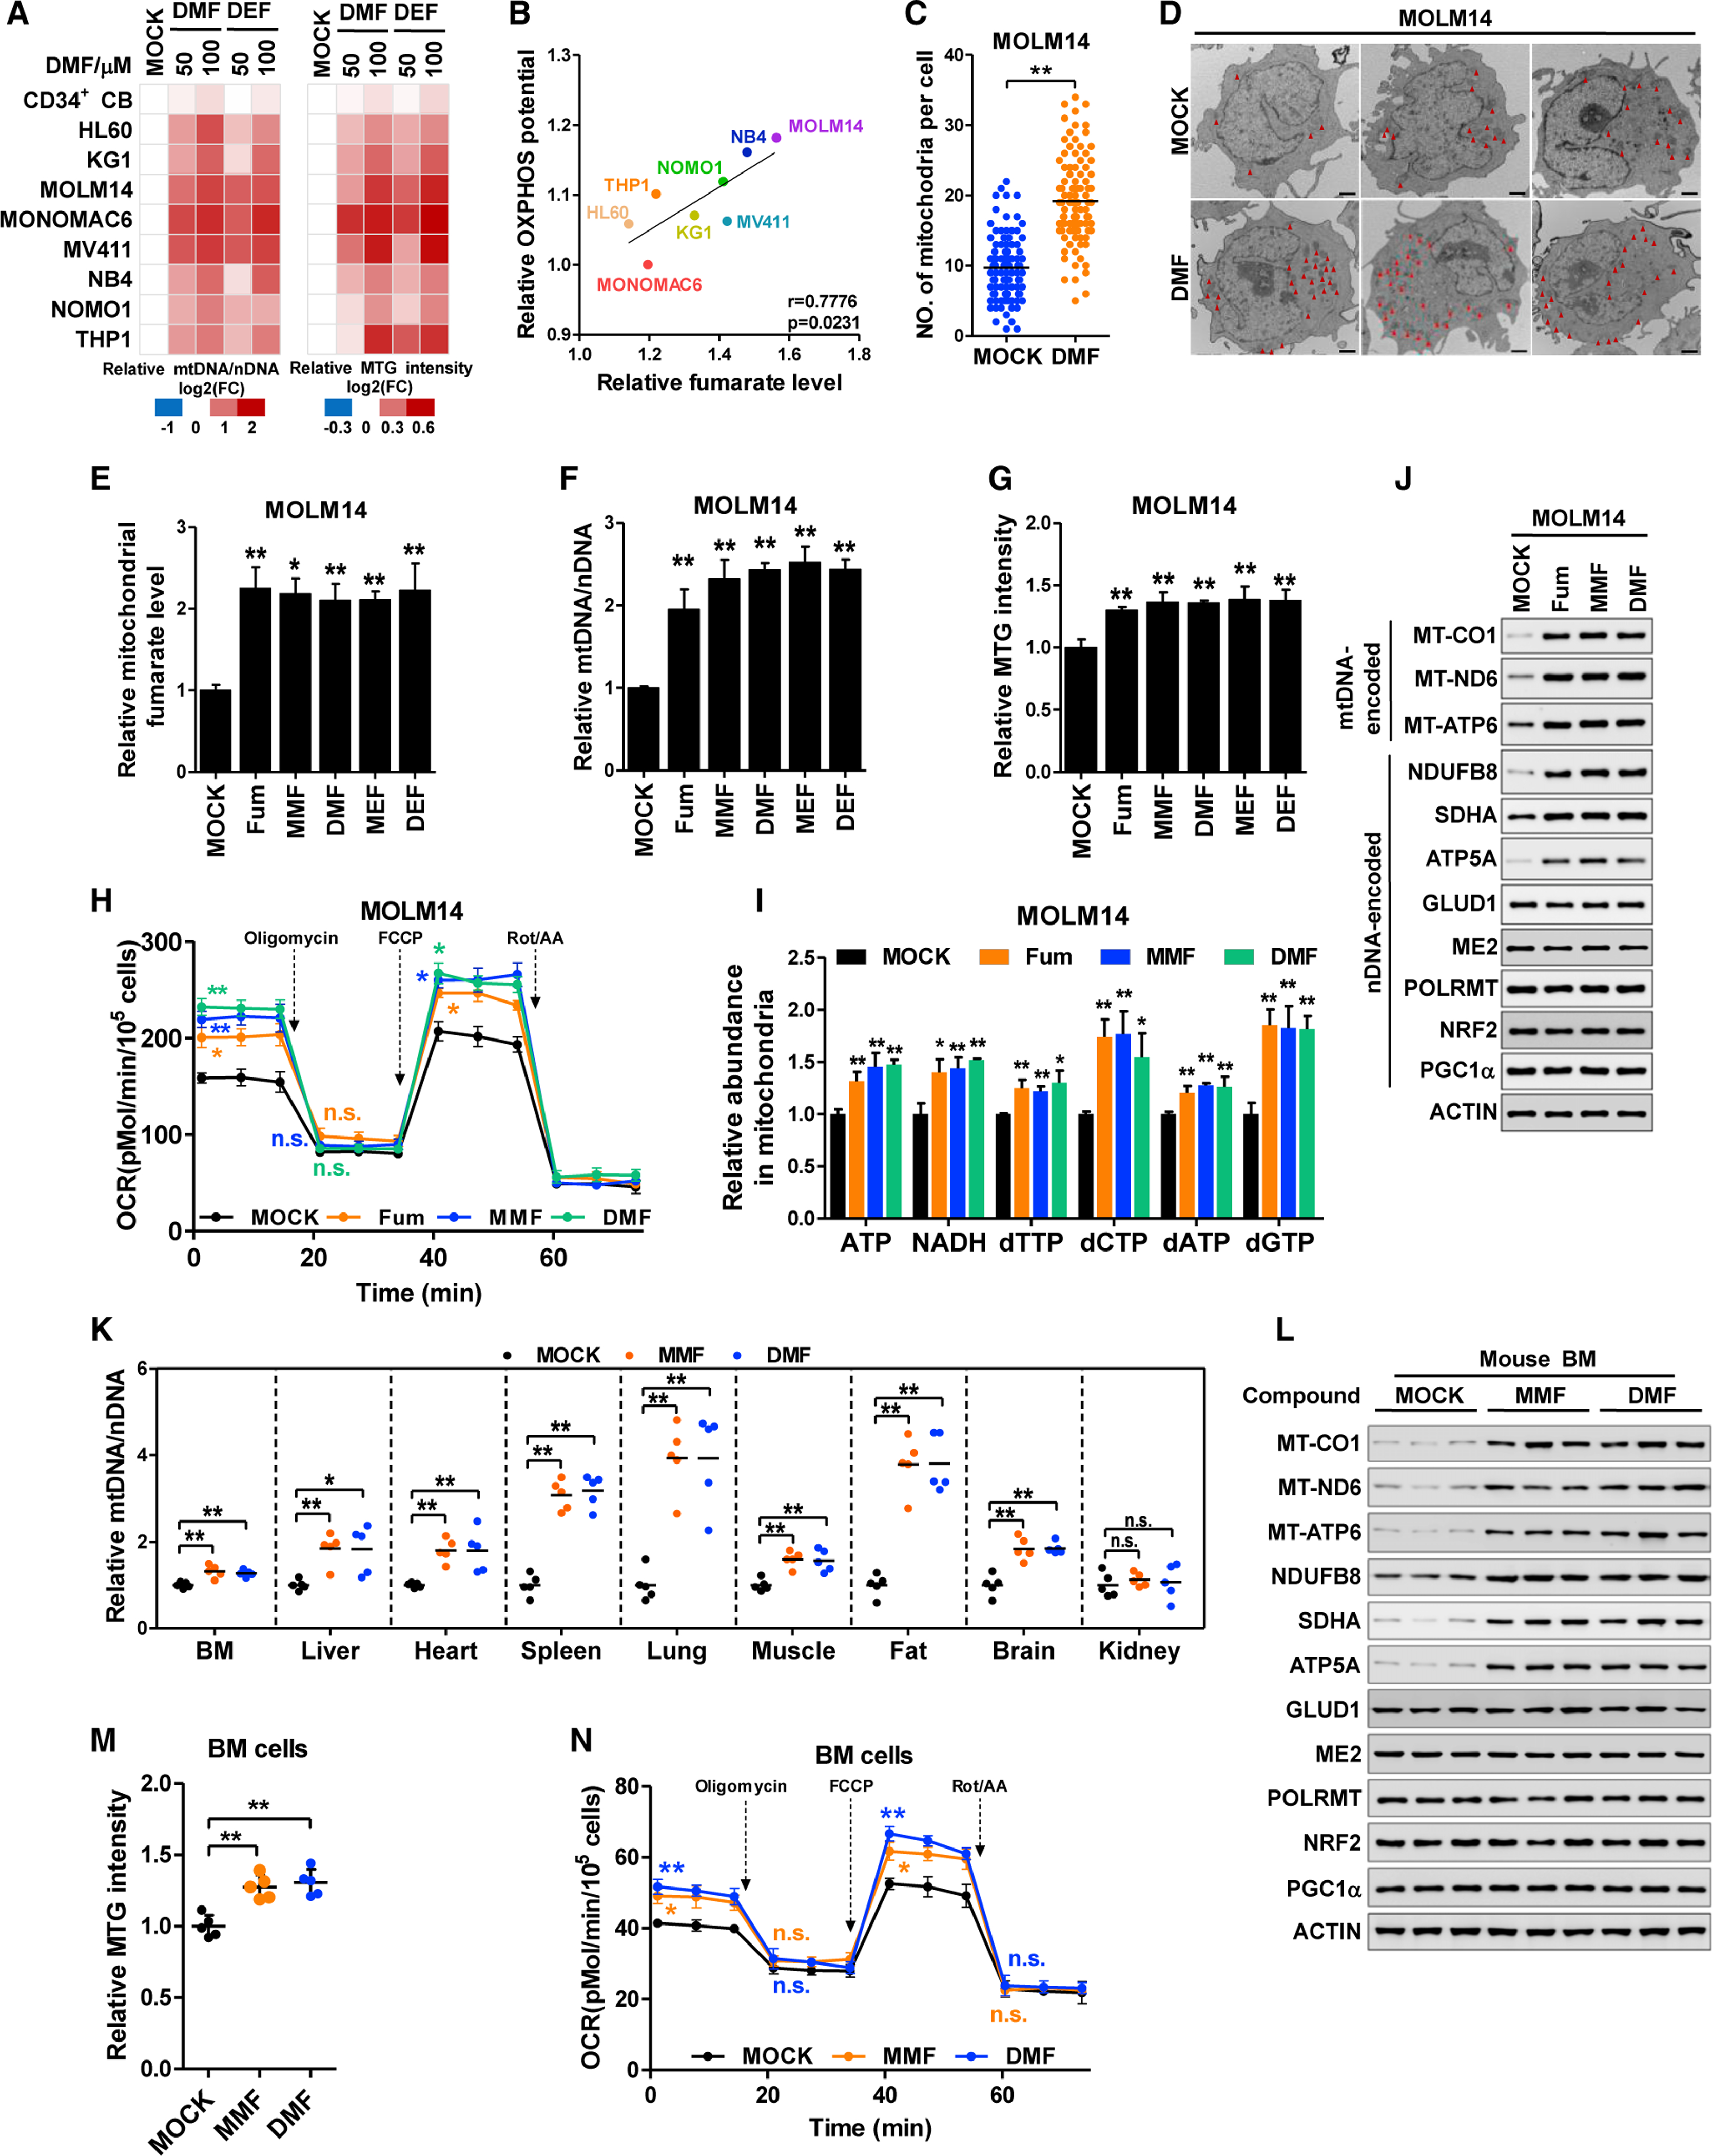
Figure 1. Fumarate upregulates mitochondrial biomass.

(A) Human cord blood CD34+ cells and AML cell lines were treated with DMF or DEF for 24 h. mtDNA was determined by qPCR and normalized to nDNA (left). Cells were stained with MTG and the fluorescent intensity was normalized to cell number (right). All data were normalized to DMSO-treated group. The fold change (FC) was presented on a log2 scale.
(B) Pearson correlation of fumarate and maximum respiration capacity (OXPHOS potential) of AML cell lines.
(C and D) Control and DMF-treated MOLM14 cells were analyzed with transmission electron microscopy. Mitochondria numbers in 100 cells were counted (C). Representative images were shown in (D) (scale bar, 1 μm).
(E–J) MOLM14 cells were treated with fumarate (Fum) and its esters for 24 h. Mitochondrial fumarate (E), mtDNA copies (F), MTG intensity (G), oxygen consumption rate (H), and mitochondrial ATP, NADH, and dNTPs (I) were quantified. Whole-cell lysates were subjected to western blotting; β-actin (actin) was included as the loading control (J).
(K–N) Mice were injected intraperitoneally with DMSO (MOCK), MMF, or DMF for 7 days. mtDNA copies from multiple tissues were quantified (n = 5) (K). Mitochondrial proteins in the BM cells from three independent mice was determined by western blotting (L). MTG intensity (M) and oxygen consumption rate (N) of BM cells were assayed (n = 5).
All data are shown as mean ± SEM from three independent experiments. *p < 0.05, **p < 0.01; n.s. indicates not significant. See also Figure S1.
