
Figure 1.
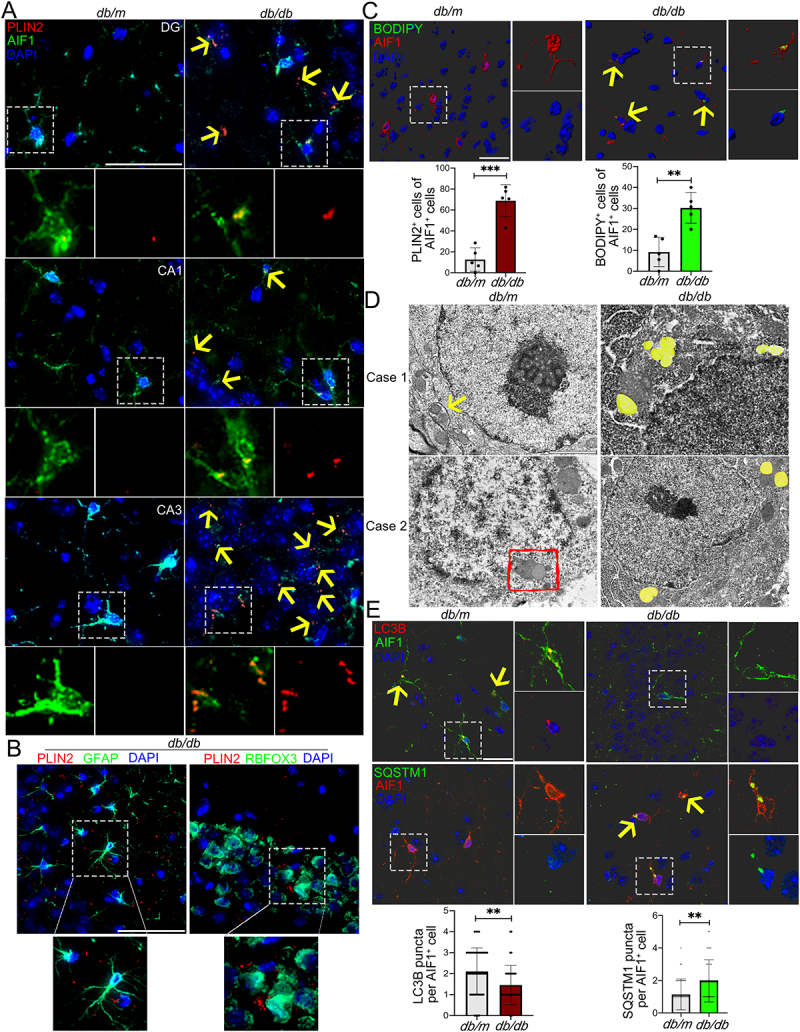
Accumulation of LDs and impaired lipophagy in hippocampal microglia of db/db mice. (A) Immunostaining of PLIN2+ (LDs) and AIF1+ (microglia), and quantification of PLIN2+ microglia (yellow arrow) in the hippocampi of db/m and db/db mice. Brain tissues were analyzed from five independent experiments (n = 5 mice per group). Scale bar: 50 μm. (B) Representative 3D reconstructions of LDs in astrocyte and in neurons in CA3 region of the hippocampus of db/db mice. Scale bar: 50 μm. (C) Representative 3D reconstructions of BODIPY+ (LDs) and AIF1+ (microglia), and quantification of BODIPY+ microglia in CA3 region of hippocampus. Scale bar: 15 μm. (D) Representative electron microscope images showing autophagosome (arrow), lipophagosome (quadrangle) and LDs (yellow) in the hippocampal microglia (n = 3 mice per group). Scale bar: 1 μm. (E) Representative 3D reconstructions of microglial lipophagy and quantification of LC3B puncta and SQSTM1 puncta in the hippocampal microglia. Lipophagy was visualized using LC3B and SQSTM1, and microglia were visualized using AIF1. Scale bar: 50 μm. ** P < 0.01, *** P < 0.001.