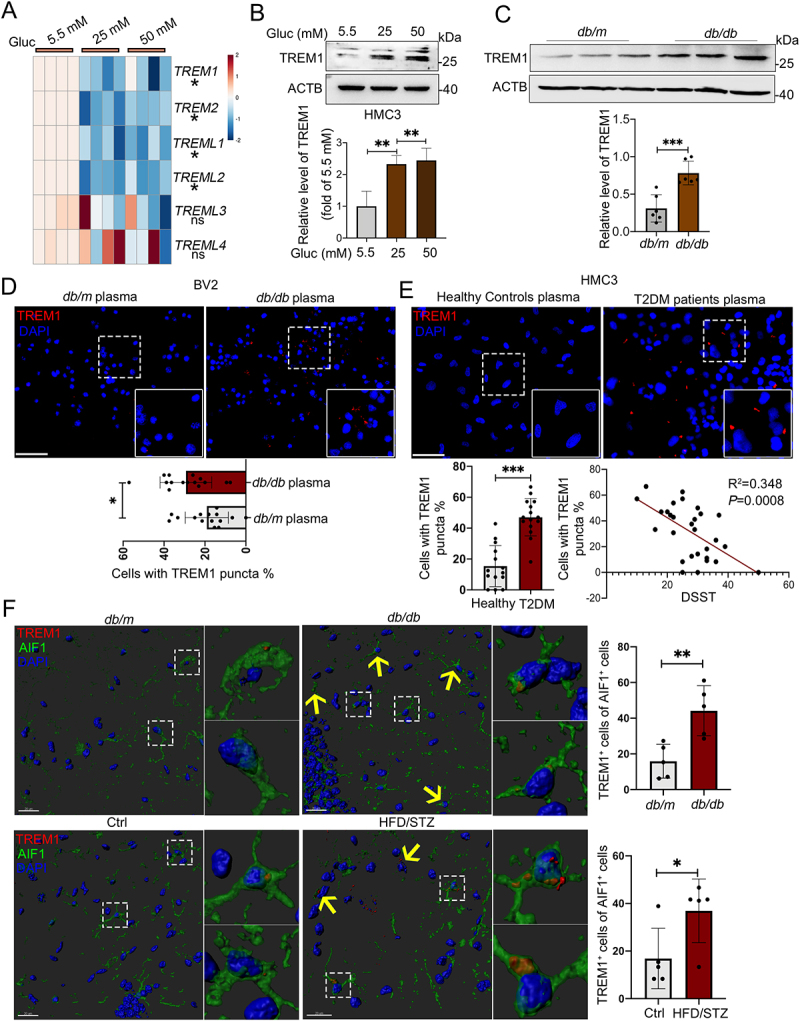
Figure 4.

Increased protein level of TREM1 in hyperglycemic plasma or HG-cultured microglia and in the hippocampal microglia of db/db mice. (A) the mRNA expression levels of TREM and TREML receptors were analyzed by RT-Qpcr and TREM1 protein expressions was detected via western blotting (B). ACTB was used as control. (C) Western blotting analysis of TREM1 protein expressions and (D) confocal images of TREM1 in BV2 cells treated with plasma of db/db mice. Scale bar: 50 μm. (E) Confocal images of TREM1 in HMC3 cells treated with T2DM patients plasma. The number of TREM1+ cells were quantified. Scale bar: 50 μm. (F) Representative Imaris 3D reconstructions of TREM1-positive expression in IBA+ microglia of the hippocampi of db/db and HFD/STZ mice. TREM1-positive cells were quantified. Scale bar: 50 μm. *P < 0.05, ** P < 0.01, *** P < 0.001.
