
Figure 5.
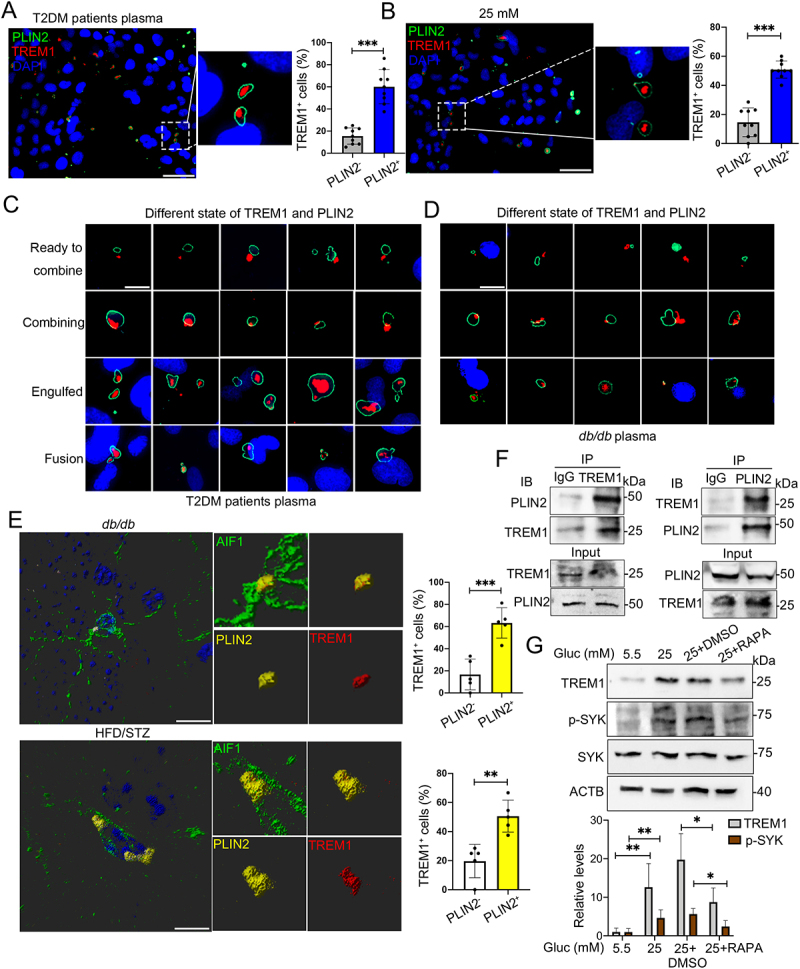
HG induced colocalization of TREM1 with LDs in microglial cells in vivo and in vitro. Representative immunostaining of TREM1 and PLIN2 in HMC3 cells cultured with plasma from T2DM patients (A) and HG (B). The number of TREM1+ cells in PLIN2− and PLIN2+ cells were quantified. Scale bar: 50 μm. (C and D) Representative micrographs of TREM1 and PLIN2 in different morphologies in HMC3 cells cultured with plasma from T2DM patients (C) and BV2 cells cultured with plasma from db/db mice (D). Scale bar: 10 μm. (E) Representative Imaris 3D reconstructions of colocalization of TREM1 and PLIN2 in the hippocampal microglia of db/db mice (upper panel) and HFD/STZ mice (lower panel). The number of TREM1+ cells in PLIN2− and PLIN2+ cells were quantified. (n = 5 mice per group, scale bar: 15 μm). (F) Co-IP validation of TREM1 and PLIN2 interaction in HMC3 cells cultured with HG. (G) Western blotting analysis of the expression of TREM1 and its downstream protein, phospho-SYK in HG and RAPA treated HMC3. ACTB was used as control. *P < 0.05, ** P < 0.01, *** P < 0.001.