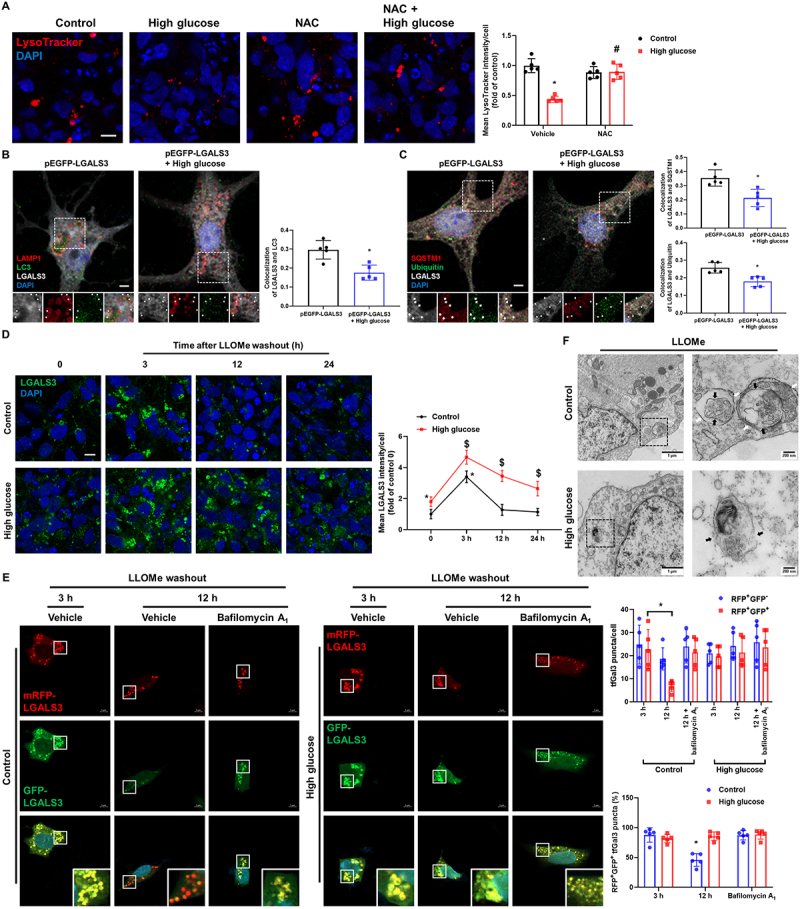
Figure 2.

High glucose suppresses lysophagy. (A) iPSC-NDs were pretreated with NAC (2 mM) for 30 min before HG exposure for 24 h. LysoTracker was visualized by confocal microscope. (B and C) Hippocampal neurons were transfected with pEGFP-LGALS3 at DIV 4 and exposed to HG for 24 h at DIV 21. (B) Representative immunofluorescence images showing LC3 and GFP-LGALS3. (C) The cells were immunostained with GFP-LGALS3, SQSTM1, and ubiquitin. Arrow indicates GFP-LGALS3 puncta with autophagic machinery. (D) iPSC-NDs were treated with LLOMe (1 mM) for 1 h after HG exposure for 24 h and then washed away. The cells were further incubated for 3 or 12 or 24 h in the incubator. Immunofluorescence staining of LGALS3 was visualized. *P < 0.05 versus control at 0; $P <0.05 versus HG at 0. (E) SH-SY5Ys were transfected with tfGal3 prior to HG exposure for 24 h followed by LLOMe (1 mM) washout assays for 3 or 12 h. Bafilomycin A1 (10 nM) was pretreated for 30 min before incubation for 12 h. mRFP-LGALS3 and GFP-LGALS3 were visualized. *P < 0.05 versus control at 3 h. (F) SH-SY5Ys were exposed to HG for 24 h prior to treatment of LLOMe (1 mM) for 1 h. The cells were then fixed and observed by transmission electron microscopy. black arrow: lysosomal membrane; white arrow: autophagosome. n = 5. Scale bars: 8 μm. All data are representative. Quantitative data are represented as mean ± SD. *P < 0.05 versus control; #P <0.05 versus HG.
