Figure 1.

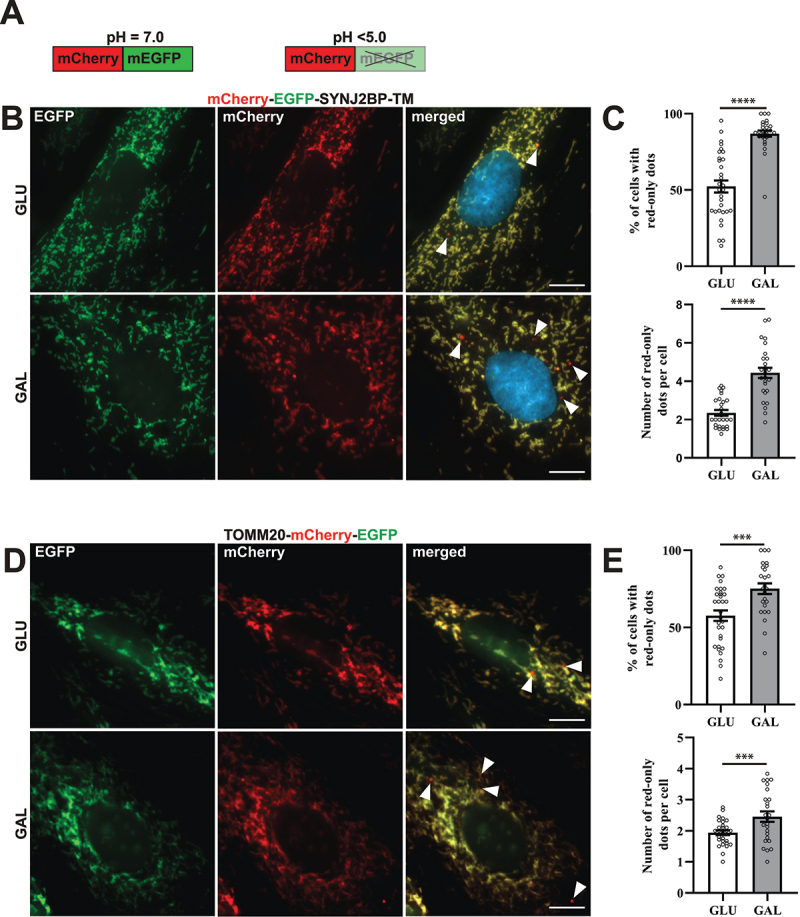
Reporter H9c2 cells display an increase in acidic mitochondria during galactose adaption. (A) An illustration of the pH-sensitive tandem fluorescent reporter mCherry-EGFP at different pH levels (red and green at neutral pH and red-only at acidic pH). (B) Representative widefield fluorescence microscopy images of H9c2 cells with a stable expression of the mCherry-EGFP-SYNJ2BP-TM reporter grown in glucose (GLU) or adapted to galactose (GAL) media. (C) Quantification of the percentage of cells containing red-only dots and quantification of the number of red-only dots per cell in cells with red-only dots in glucose vs galactose media for cells with the mCherry-EGFP-SYNJ2BP-TM reporter. (D) Representative widefield fluorescence microscopy images of H9c2 cells with a stable expression of the TOMM20-mCherry-EGFP reporter grown in glucose (GLU) or adapted to galactose (GAL) media. (E) Quantification of the percentage of cells containing red-only dots and quantification of the number of red-only dots per cell in cells with red only dots in glucose vs galactose media for cells with the TOMM20-mCherry-EGFP reporter. Data presented in (C) and (E) is shown as mean ± SEM from 3 independent experiments, with more than 100 cells in each condition. The individual datapoints are per frame cell averages.
Note: * p < 0.05, ** p < 0.01, *** p < 0.001 and **** p < 0.0001. Scale bar: 10 μm.
