Figure 2.

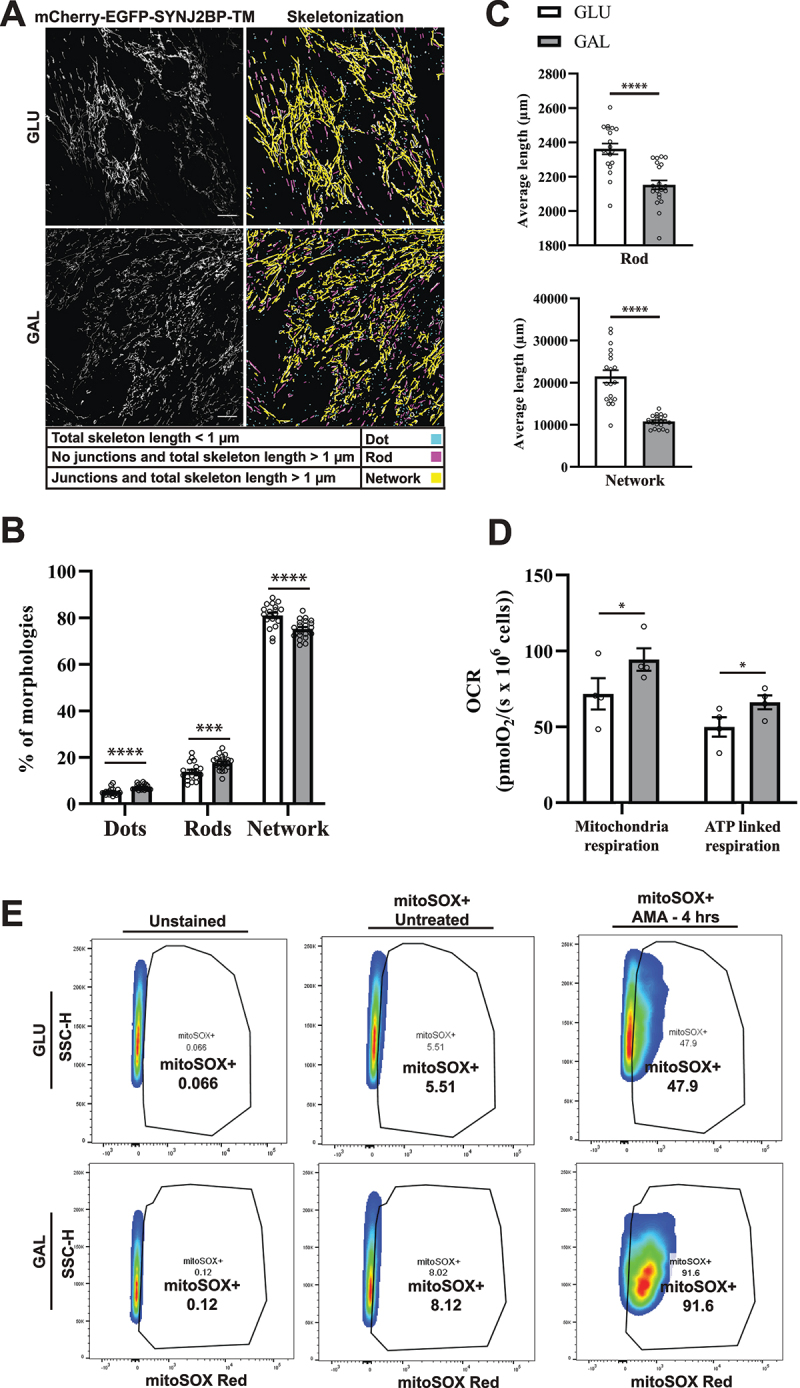
Mitochondria morphology analysis, mitochondrial respiration and ROS measurements indicate more fragmented mitochondria and OXPHOS dependance after galactose adaptation. (A) Morphological analysis of confocal images of cells grown in glucose vs galactose media. A representative skeletonization mask is depicted for each culture condition with the different morphology classes indicated in different colors. Rules for morphology classes are displayed at the bottom. (B) Overview of the distribution of mitochondria morphology classes in percentage for the two different growth conditions. The distribution for glucose vs galactose adaption is 5.16% vs 7.14% for dots, 13.79% vs 17.58% for rods and 81.04% vs 75.28% for network. (C) Quantification of the average length of mitochondria in the rod and network morphology classes for cells grown in glucose vs galactose. (D) High-resolution respirometry performed in an Oxygraph-2k (Oroboros Instruments). Oxygen consumption rate, OCR (pmolO2/s × 106 cells) of cells grown under normal conditions (high glucose) or adapted to galactose was corrected for residual oxygen consumption (ROX) and normalized to the cell number per ml in the chambers. The values displayed in the graph are from four independent experiments ± SEM, indicating mitochondrial respiration (basal respiration minus ROX) and ATP-linked respiration (basal respiration minus proton leak), respectively. (E) Flow cytometry analysis of H9c2 cells grown in normal media with glucose or adapted to galactose. The antimycin A (AMA) treated/untreated cells were stained with mitoSOX Red and compared with unstained cells as a negative control. During normal culture conditions, antimycin A treatment resulted in approximately 47% mitoSOX Red positive cells, while in galactose 91% of the cells were mitoSOX Red positive. The data depicted represent one of three independent experiments. Data presented in (B) and (C) is shown as mean ± SEM of 20 fields of view per condition. The individual datapoints are per frame cell averages.
Note: * p < 0.05, ** p < 0.01, *** p < 0.001 and **** p < 0.0001. Scale bar: 10 μm.
