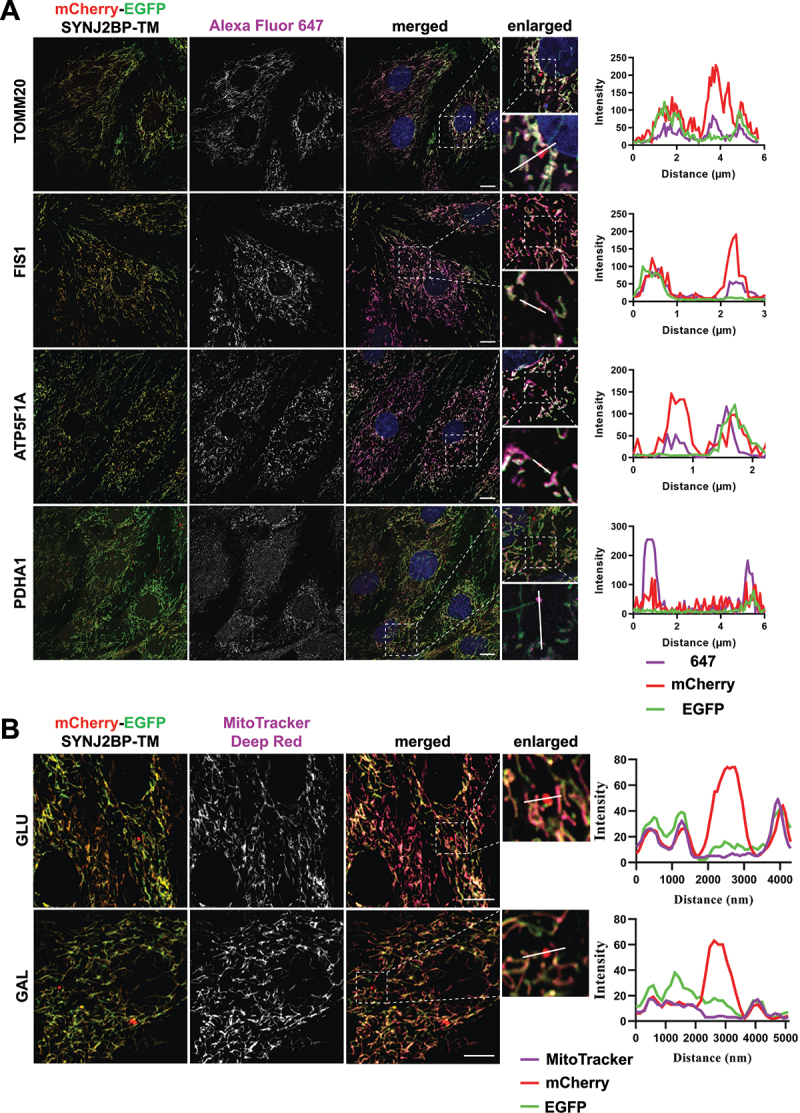
Figure 3.

Red-only dots colocalize with mitochondrial markers of different mitochondrial compartments and lack membrane potential. (A) Confocal microscopy images of fixed tandem- tagged (mCherry-EGFP-SYNJ2BP-TM) H9c2 cells demonstrating colocalization of red-only dots with mitochondrial marker proteins of the different mitochondrial compartments; FIS1 and TOMM20 (outer membrane), ATP5F1 A (inner membrane) and PDHA1 (matrix). Region of interest for each marker is presented in a zoomed-in image with a line profile including an enlarged red-only dot displaying the colocalization. (B) Confocal microscopy images of live H9c2 cells with the mCherry-EGFP-SYNJ2BP-TM reporter and MitoTracker Deep Red staining for both glucose and galactose adapted cells. The enlarged region of interest depicts line profiles demonstrating colocalization of MitoTracker Deep Red in mitochondrial networks, but lack of colocalization in red-only dots. Scale bar: 10 μm.
