Figure 4.

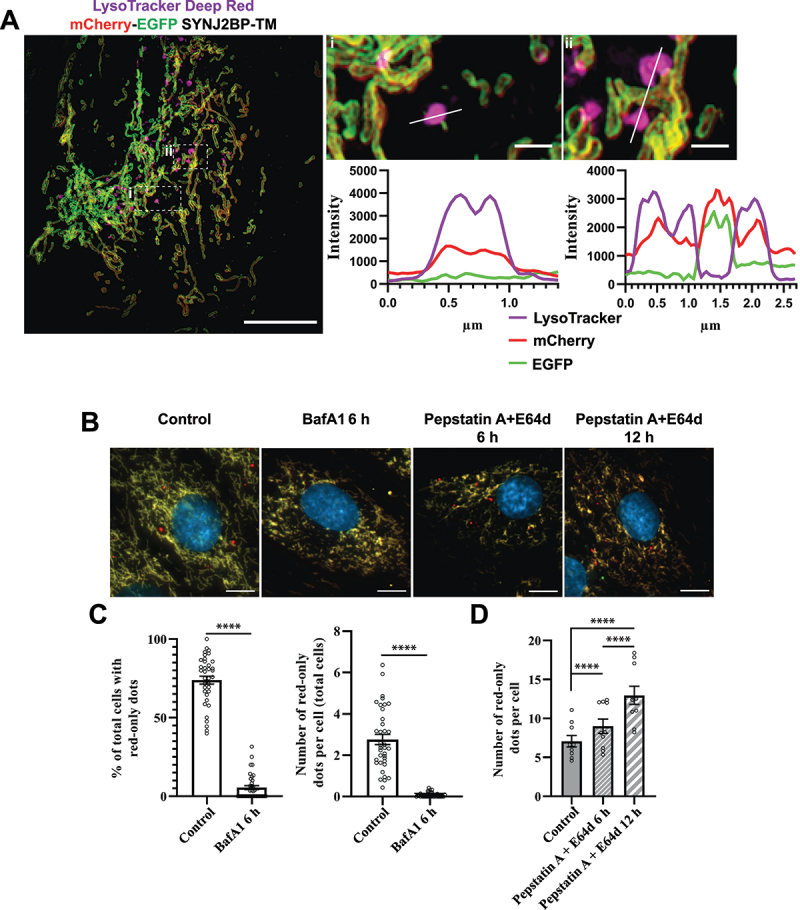
Functional lysosomes are essential for the appearance and removal of red-only dots during galactose adaption. (A) Structured illumination microscopy (SIM) imaging of fixed mCherry-EGFP-SYNJ2BP-TM H9c2 cells showing red-only dots that are positive for LysoTracker DeepRed staining (magenta). Line profiles through the LysoTracker-positive red-only dots in the enlarged boxed regions of interest are depicted, with corresponding numbers between the overview image and enlarged images. (B) Representative images of galactose adapted mCherry-EGFP-SYNJ2BP-TM H9c2 cells during control conditions and after treatment with the lysosomal inhibitors bafilomycin A1 (BafA1; 200 nM) and pepstatin a (PepA;10 μg/ml) and E64d (10 μg/ml) for the indicated times. (C) Quantification of the effects of a 6 h treatment of BafA1 on galactose adapted cells with the mCherry-EGFP-SYNJ2BP-TM reporter by assessing the percentage of cells containing red-only dots and number of red-only dots per total cells. (D) Quantification of the effects of a time course treatment of PepA and E64d assessed by number of red-only dots per cell in cells with red-only dots in galactose adapted cells with the mCherry-EGFP-SYNJ2BP-TM reporter. Over 150 cells were analyzed for each condition. The data is presented as mean ± SEM from 3 independent experiments, with more than 100 cells per condition. The individual datapoints are per frame cell averages. NOTE: * p < 0.05, ** p < 0.01, *** p < 0.001 and **** p < 0.0001. Scale bars: 10 μm and 1 μm (Ai and Aii).
