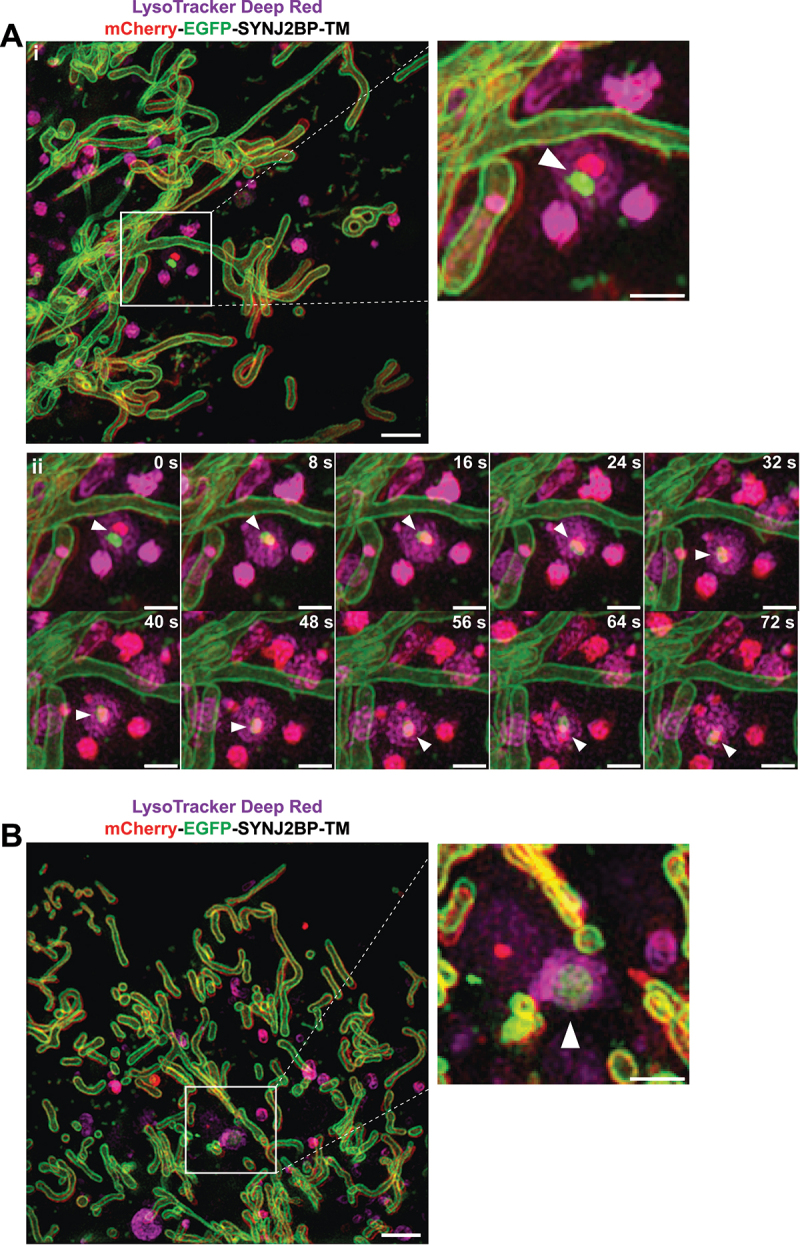
Figure 5.

Three-dimensional (3D) structured illumination microscopy (SIM) live cell imaging of mCherry-EGFP-SYNJ2BP-TM H9c2 cells captures mitochondrial fragments within acidic structures. (Ai) A still frame overview image (merged channels) from the start of Video S1 displaying a cell during normal culture conditions after adding the LysoTracker Deep Red dye (100 nM for 40 min). The boxed area indicates a mitochondrial fragment with both EGFP and mCherry fluorescence inside a LysoTracker Deep Red-positive structure. The channels for red and green fluorescence are slightly shifted due to the time-delay between images of the different channels. The region of interest is shown as an enlarged image and the structure is highlighted with an arrowhead. (Aii) A time series of the boxed area in Video S1 following the movement of the lysosome containing the mitochondrial fragment (arrowhead). (B) A still frame overview image (merged channels) from the start of Video S2 displaying a cell after galactose adaptation after adding the LysoTracker Deep Red dye (100 nM for 40 min). The boxed area indicates a mitochondrial fragment with both EGFP and mCherry fluorescence inside a LysoTracker Deep Red-positive structure. The region of interest is shown as an enlarged image with the identified structure highlighted with an arrowhead. Max projection was utilized for all the images. Scale bars: 2 μm (overview images) and 1 μm (the enlarged images and for the time series).
