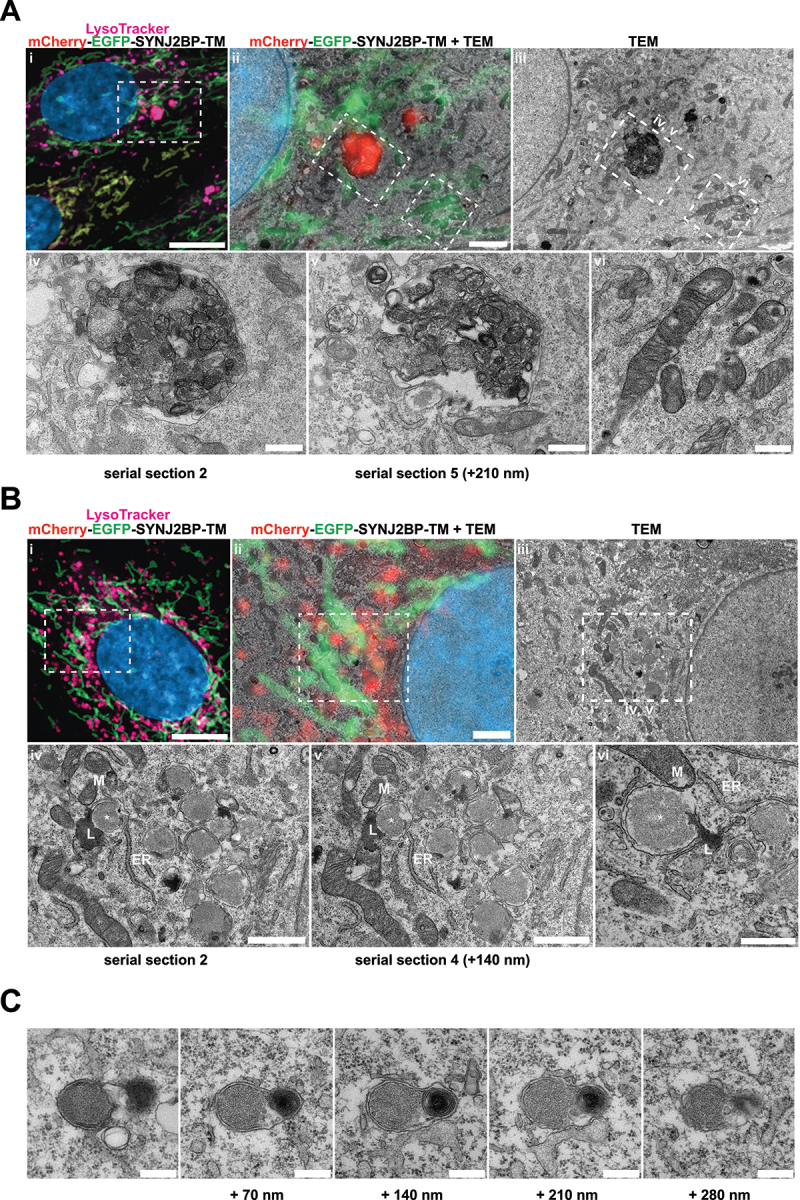
Figure 7.

Correlative light and electron microscopy of mCherry-EGFP- SYNJ2BP-TM H9c2 cells reveals the ultrastructure of red-only dots. (A) Red-only dots in cells grown in media containing glucose correspond to autophagic vacuoles with a diverse internal milieu at varying stages of cargo engulfment and maturation (A iv-v). Meanwhile, mitochondria displaying both EGFP and mCherry fluorescence have a normal tubular morphology with distinct inner and outer membranes and intact cristae (A vi). (B) Structures corresponding to red-only dots in galactose adapted cells are more uniform and less electron dense. Imaging of consecutive ultrathin sections (B iv-vi) revealed that these structures are in close proximity (or may be continuous) with membranes of the endoplasmic reticulum (ER) and mitochondria (M). Also note apparent lysosomes (L) at the periphery of red-only structures (*). Scale bars: 10 μm (A i and B i), 2 μm (A ii and B ii), 1 μm (B iv and B v) and 0.5 μm (A iv-vi and B vi). (C) Serial section TEM imaging of a red-only dot shows a single membrane vesicle with apparent remnants of mitochondria and a multilamellar lysosome. Scale bar: 0.3 μm.
