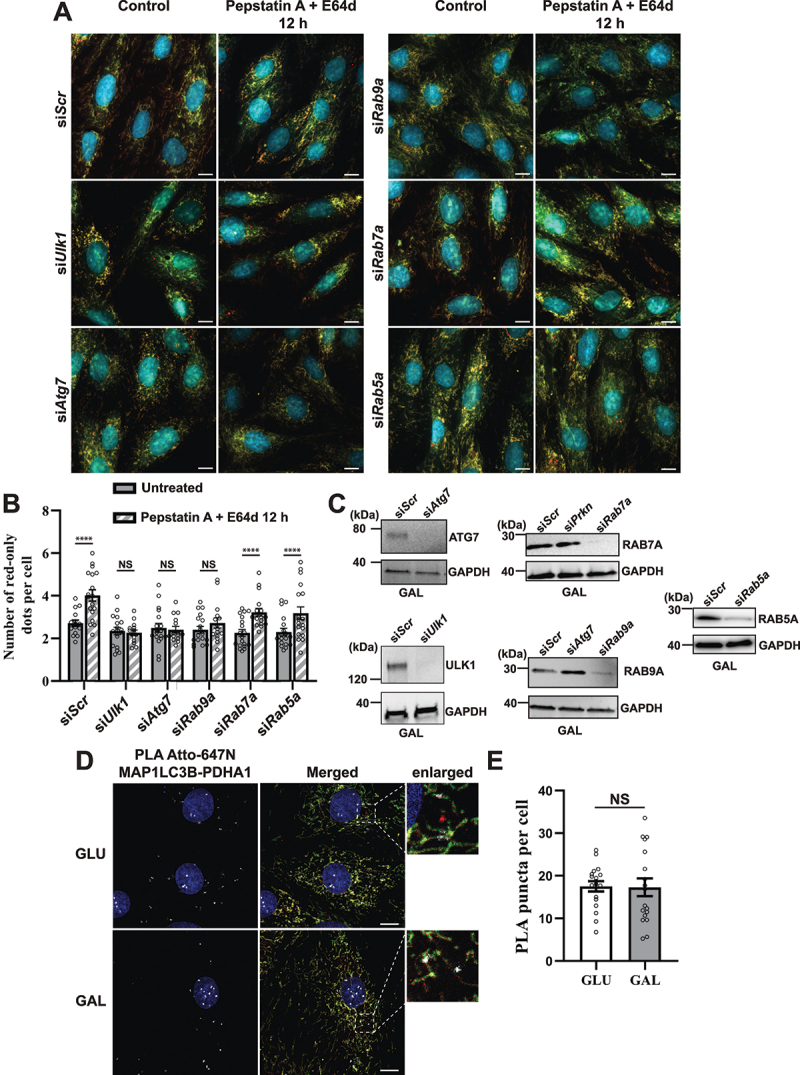
Figure 8.

Effect of siRNA knockdowns on mitophagic flux and evaluation of LC3 involvement by proximity ligation assay (PLA). (A) Representative widefield images of mCherry-EGFP- SYNJ2BP-TM H9c2 cells analyzed 48 h after transfection with scrambled siRNA (siScr) or siRNA against Ulk1, Atg7, Rab9a, Rab7a or Rab5a respectively. (B) Quantification of the effect of 48 h siRNA knockdowns by assessment of number of red-only dots per cell in cells containing red-only dots in control conditions against a 12 h PepA and E64d treatment. The data is presented as mean ± SEM from 3 independent experiments, with more than 100 cells per condition (total number analyzed per experiment was over 1200 cells). (C) Western blots showing the expression levels of the siRNA targeted proteins in control and siRNA treated cells for verification of successful knockdown. (D) Representative confocal images of detected PLA puncta (white) using anti-MAP1LC3B and anti-PDHA1 antibody during normal (GLU) and galactose (GAL) adapted conditions. The enlarged boxes display the PLA puncta on the mitochondria network and small mitochondrial fragments but their absence on red-only dots. (E) Quantification of the number of PLA puncta per cell in 10 images (with more than 50 cells in total) per condition from two independent experiments. The individual datapoints are per frame cell averages. * p < 0.05, ** p < 0.01, *** p < 0.001 and **** p < 0.0001. Scale bar: 10 μm.
