Figure 3.
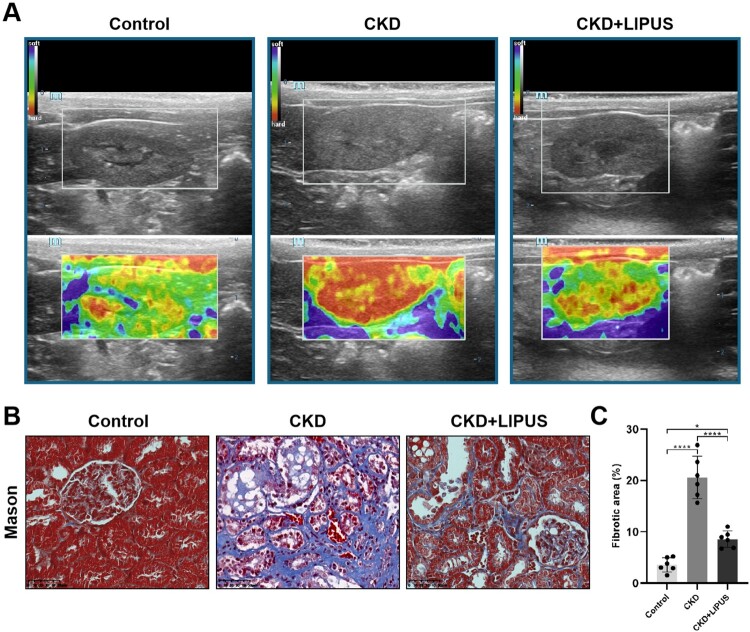
Treatment with LIPUS ameliorated kidney hardness and renal fibrosis in the ADR-induced CKD rat. (A) Representative elastic map of each group on the classical ultrasound image in coronal views. The elastic map is colour-coded from 0 to 45 kPa, with red representing the hardest, yellow representing relatively hard, green representing relatively soft, and blue represents the softest. (B) Representative micrographs of Masson’s trichrome staining in each group. Scale bar, 50 μm. (C) Quantification of fibrotic area, expressed as a percentage of the total area. Data represent the mean ± standard error of the mean (SEM) for 6 rats in each group. *p < 0.05, **** p < 0.0001.

