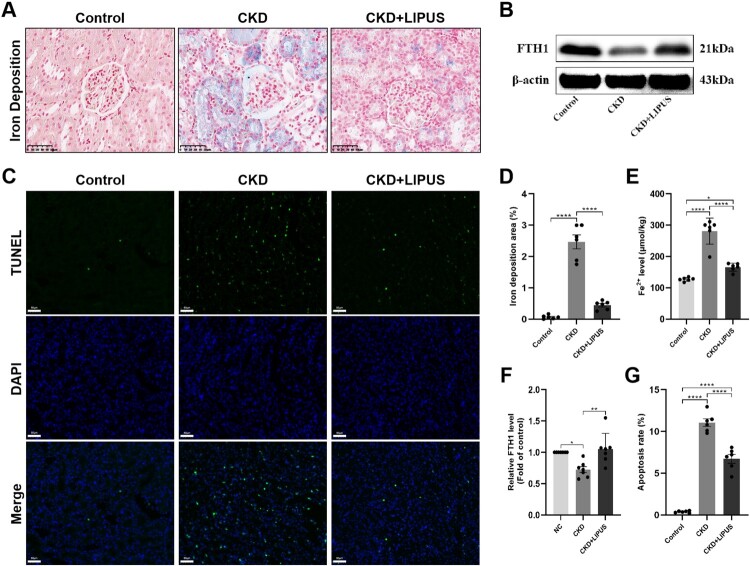
Figure 5.
Treatment with LIPUS improved iron deposition and apoptosis in the ADR-induced CKD rat. (A) Representative micrographs of iron staining in each group. Scale bar, 50 μm. (D) Quantification of iron deposition area, expressed as a percentage of the total area. (E) The levels of Fe2+ in rat kidney tissue were assayed by enzyme linked immunosorbent assay (ELISA). (B) The protein expression level of ferritin heavy chain 1 (FTH1) in rat kidney tissue was assayed by western blotting (WB). (F) Relative expression levels of FTH1. (C, G) Representative micrographs of TUNEL staining and result of apoptosis analysis in each group. Data represent the mean ± standard error of the mean (SEM) for 6 rats in each group. *p < 0.05, ** p < 0.01, **** p < 0.0001.

