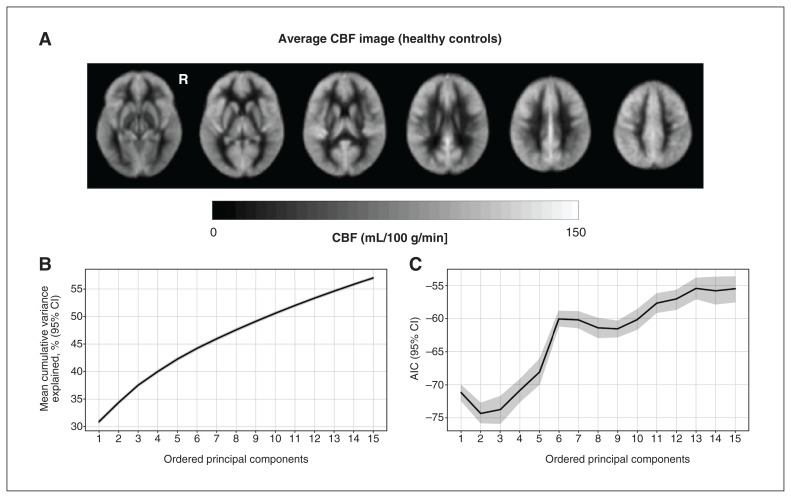
Figure 1.
(A) Group average cerebral blood flow (CBF) image for the healthy controls; this was visually representative of the group with bipolar disorder. (B) Percent variance explained by the principal components, calculated from quantitative CBF data. Solid line shows mean across cross validation folds and translucent band shows 95% confidence intervals (CIs); note that the CI closely overlaps with the mean. (C) Akaike information criteria (AIC), as a function of the number of included principal components, is shown for logistic regression models fit using multivariate information from the quantitative CBF data. Lower AIC values indicate a better model fit. R = right hemisphere.

