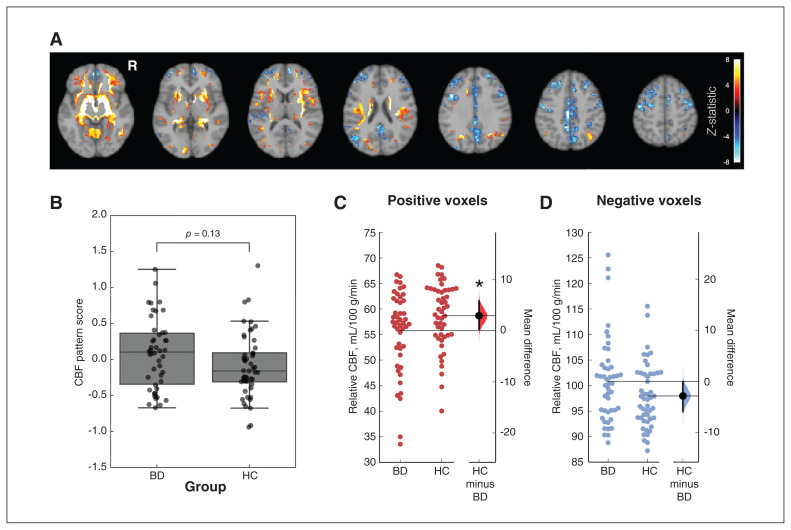
Figure 2.
(A) Composite cerebral blood flow (CBF) pattern associated with bipolar disorder (BD), overlaid on a reference T1-weighted image. Colours indicate z-scored voxel intensity and are unitless. No-coloured regions were not statistically significant after cluster-based thresholding. (B) Expression scores of the CBF pattern in the CBF image of each participant. We calculated a group comparison p value through the permutation-based null distribution of the difference in mean scores. Panels (C) and (D) show the mean relative CBF (intensity-normalized to a mean of 80 mL/100 g/min) and difference between youths with and without BD in the region-of-interest analysis for positive and negative voxels, respectively. Horizontal lines indicate group means. Error bars indicate the 95% confidence intervals. Density plots show the bootstrapped distribution and confidence intervals for the HCs minus the BD condition. HC = healthy control; R = right hemisphere. *p < 0.05.

