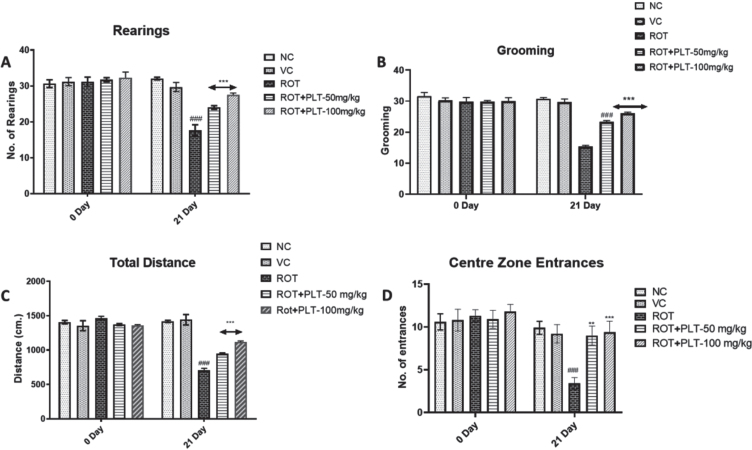
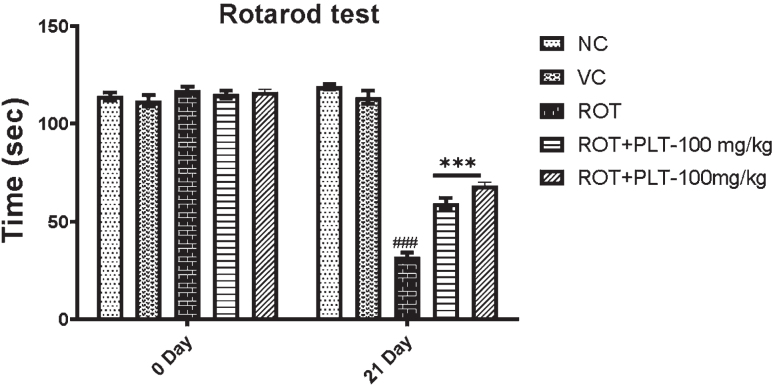
Fig. 2.
A) Locomotor activity of animals in the open field test (Rearing, Grooming, Total Distance Travelled, and Central Zone Entrances). Data expressed as mean±SEM, n = 10. ###p < 0.001 versus NC, **p < 0.01, ***p < 0.001 versus ROT. One-way ANOVA was followed by the Tukey test as a post-ANOVA test for multiple comparisons. B) Rotarod performance in different experimental groups. The total time remaining on the revolving rod was recorded. Data expressed as mean±SEM. N = 10. ###p < 0.001 versus NC, **p < 0.01, ***p < 0.001 versus ROT. One-way ANOVA was followed by the Tukey test as a post-ANOVA test for multiple comparisons. The result with p < 0.05 were considered statistically significant.


