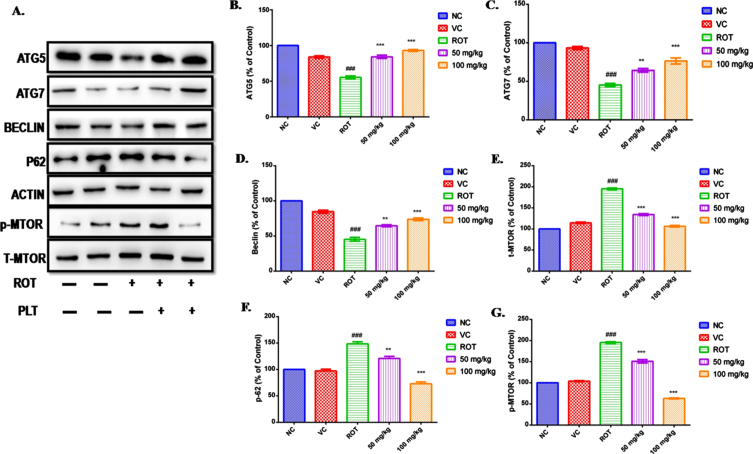
Fig. 5.
Effect of PLT on autophagy control: NC, Normal control; VC, Vehicle control; ROT, Disease control. ROT treated with PLT 50 and 100 mg/kg, p.o. respectively. ###p < 0.001 versus NC, ns, non-significant, **p < 0.01, ***p < 0.001 versus ROT. One-way ANOVA was applied to statistical analysis, followed by post hoc analysis by “Bonferroni’s multiple comparison tests”. The results obtained are presented as mean±SEM (n = 3) and results with p < 0.05 were considered statistically significant.

