Fig. 7.
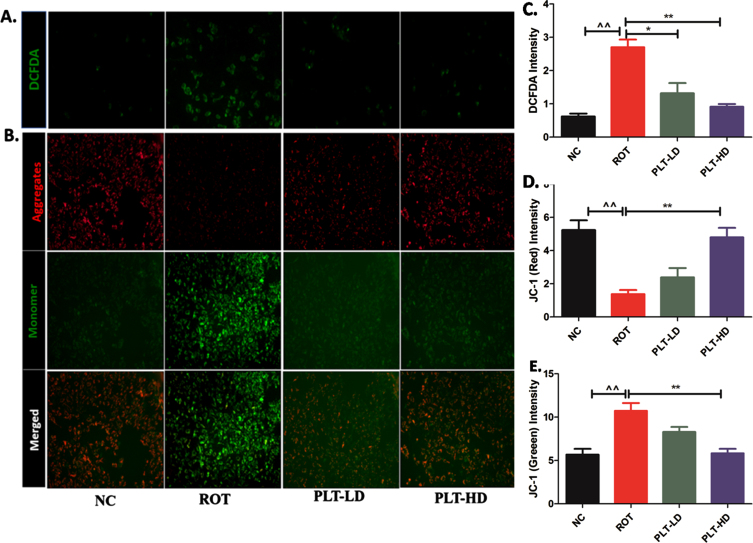
The effect of PLT exposure on ROS production and mitochondrial membrane potential (MMP): ROS and MMP were quantified using DCFDA and JC-1 dye respectively. Panel A represents DCFDA-positive cells and panel C shows changes in the DCFDA intensity after ROT and Phloretin treatment. Panel B shows aggregate (Red Fluorescence) and monomer form (Green fluorescence) of mitochondria and panels D and E shows changes in red and green fluorescence intensity after ROT and PLT exposure. (***p < 0.001, **p < 0.01 and *p < 0.05). One-way ANOVA was applied to statistical analysis, followed by post hoc analysis by “Bonferroni’s multiple comparison tests”. The results obtained are represented as mean±SEM and results with p < 0.05 were considered statistically significant.

