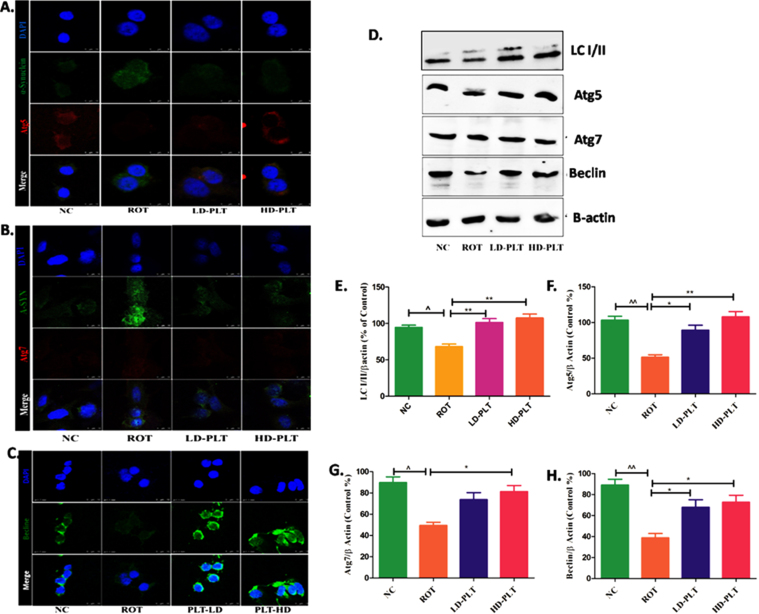
Fig. 10.
Effect of PLT exposure on autophagic proteins in ROT-exposed SH-SY5Y cells. Representative IF images of SH-SY5Y cells labeled with A) Atg-5, B) Atg-7, C) Beclin. D) Western blot image of LC3B-I/II, Atg-5, Atg-7, and Beclin in PLT and ROT exposed SH-SY5Ycells by western blotting. Quantitative densitometric analysis of E) LC3B I/II, F) Atg-5, G) Atg-7, and H) Beclin using Image J software. The results obtained are represented as mean±SEM (n = 3). ***p < 0.001, **p < 0.01 and *p < 0.05 versus ROT, ∧∧p < 0.01 and ∧p < 0.05 versus ROT.

