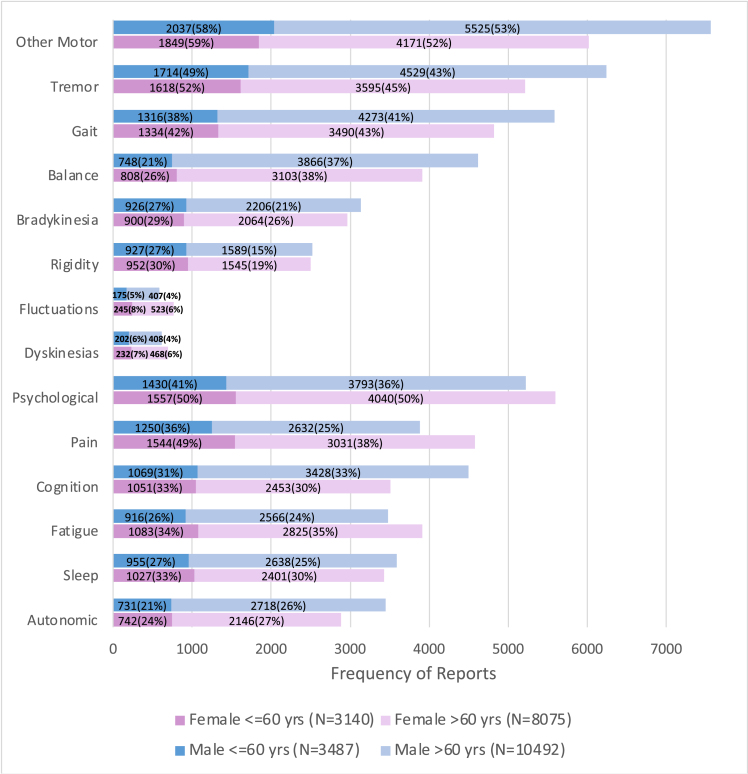
Fig. 2.
Frequency* of patient reports of problems by domain, age, and gender. The denominator for percentages is the N given in the legend for the corresponding demographic category. *Calculated as the ratio of the number of individuals reporting the symptom at least once to the number of individuals in that demographic category.

