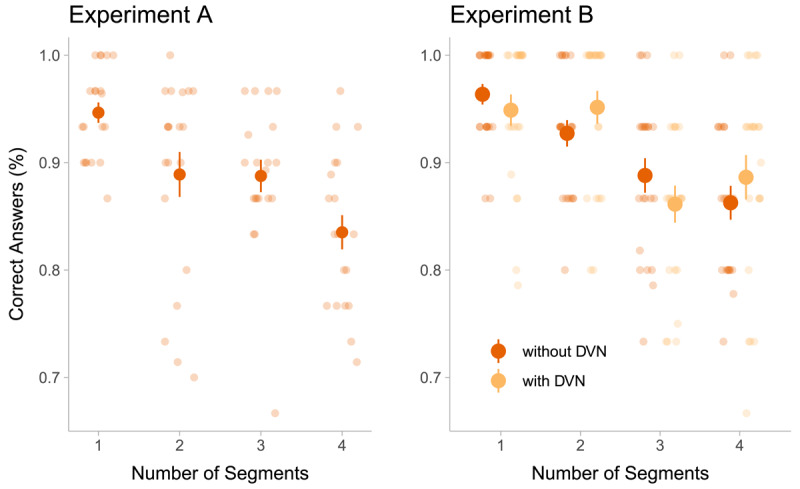
Figure 3.

Performance in the maintenance task in Experiment A and B as a function of the number of segments in a stimulus. Opaque points indicate the mean across participants, and error bars indicate the standard error of the mean. In Experiment B, two seconds of dynamic visual noise (DVN) between the stimulus and the blank screen were introduced in half of the trials. The trials without DVN in Experiment B were identical to the trials in Experiment A. Transparent points show the average performance of individual participants over trials with the respective number of segments. Given that each participant absolved 120 trials in total, the points in the figure of Experiment A represent the average of 30 trials (120 trials/4 levels of segments), while the points in Experiment B represent the average accuracy of 15 trials (120 trials/4 levels of segments/2 levels of DVN).
