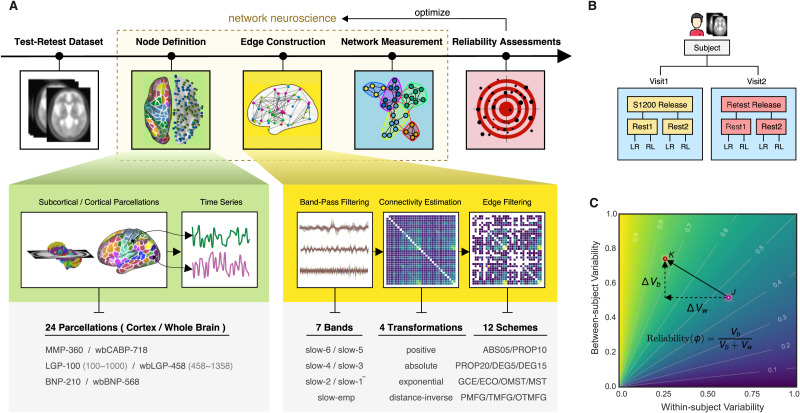
Figure 1. .
Analytical pipelines for reliable ifNN. (A) There are five stages during our analyses: (1) test-retest dataset (white box) downloaded from HCP website; (2) node definition (green box) defining nodes using a set of brain areas of 24 different partitions of the human brain; (3) edge construction (yellow box) estimating individual correlation matrices using the six frequency bands (slow 1–6) from Buzsaki’s theoretical framework on the brain oscillations as well as the widely used empirical frequency band (Slow-emp) and transferring these matrices into adjacency matrices using 7 × 4 × 12 different strategies on edge construction including band-pass filtering, connectivity estimation and edge filtering; (4) network analysis (blue box) systematically calculating various brain graph metrics on measurements of information flow; and (5) reliability assessment (red box) evaluating test-retest reliability with massive linear mixed models. (B) The test-retest data shared multimodal MRI datasets of 46 subjects in the HCP S1200 release and the HCP Retest release. Each subject underwent the first four test scans on 2 days (two scans per day: Rest1 and Rest2) and return several months later to finish the four retest scans on another 2 days. (C) Measurement reliability refers to the interindividual or between-subject variability Vb relative to the intraindividual or within-subject variability Vw. Variability of both between-subject (Vb) and within-subject (Vw) are normalized into between 0 and 1 by the total sample variances. Their changes (ΔVb and ΔVw) introduce a reliability gradient as represented by the vector (the black arrow). The length of the arrow reflects the amplitude of reliability changes when the reliability assessment from one choice (pink circle, J) to another choice (red circle, K). Further, the arrow’s direction (JK) indicates the sources of this reliability change. Here the reliability becomes from moderate to substantial level with increases of between-subject variability (ΔVb > 0) and decreases of within-subject variability (ΔVw < 0).

