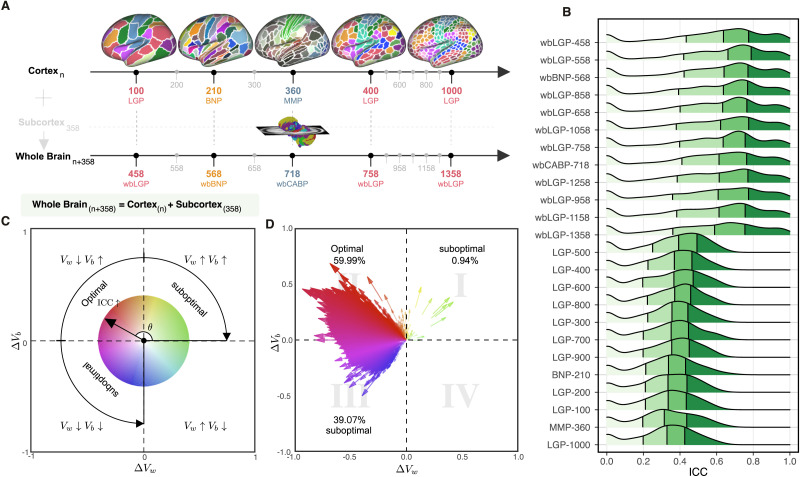
Figure 2. .
Parcellation choices impact measurement reliability and individual variability. (A) Node definitions are derived from the process of spatially partitioning the human cortex and whole brain (including both cortical and subcortical nodes) at various resolutions; see more details of these name abbreviations in Theory and Methods. (B) Density plots are visualized for distributions of the ICCs under the various parcellation choices on node definition. These density distributions are ranked from top to bottom according to decreases of the mean ICCs while the four colors depict the four quantiles. (C) Reliability gradient between any one whole-brain parcellation choice and its corresponding cortical parcellation choice is decomposed into the axis of changes of the between-subject variability (ΔVb) and the axis of changes of the within-subject variability (ΔVw). This gradient can be represented as a vector, which is the black arrow from the origin with an angle θ with the x axis, while the color encodes this angle and the transparency or the length reflects the magnitude of the degree of ICC improvement. According to the anatomy of reliability, the optimal space is in the second quadrant (quadII) while the first and third quadrant (quadI and quadIII) are suboptimal for reliability. (D) The improvement in the reliability of the pipeline, which is defined from the cortical parcellations to the corresponding whole-brain parcellations (including the subcortex), is illustrated by gradient arrows in the plane of individual variability, while controlling for all other processing steps. Each arrow represents a specific global metric, while controlling for all other processing steps. The position of the arrows reflects the magnitude of between- and within-subject variability changes (ΔVb, ΔVw), and the size of the arrows indicates the magnitude of ICC changes.

