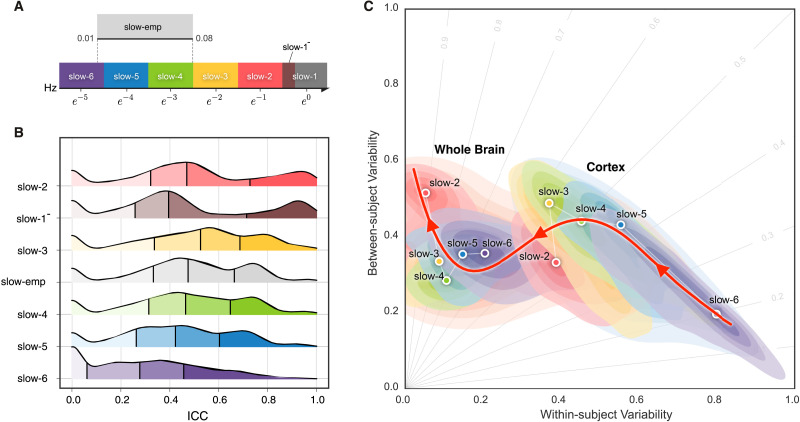
Figure 3. .
Reliability gradient across the slow bands and changes of related individual variability. (A) Classes of frequency bands for slow oscillations derived from the natural logarithm linear law. (B) Density plots are visualized for the ICC distributions under the various frequency bands. These density distributions are ranked from top to bottom according to decreases of the mean ICCs, while the vertical lines depict the four quartiles. (C) Network measurements are projected onto the reliability anatomy plane coordinated by both between- and within-subject variability. These dot plots are fitted into the topographic (contour) maps where the local maxima for each band is labeled as a circle. To highlight the trend of increasing reliability as the frequency band increases, a fourth-order polynomial curve (represented by a red line) is fitted to the frequency contour plot peak points, tracing the reliability flow along slow-to-fast oscillations in the cortex and whole brain.

