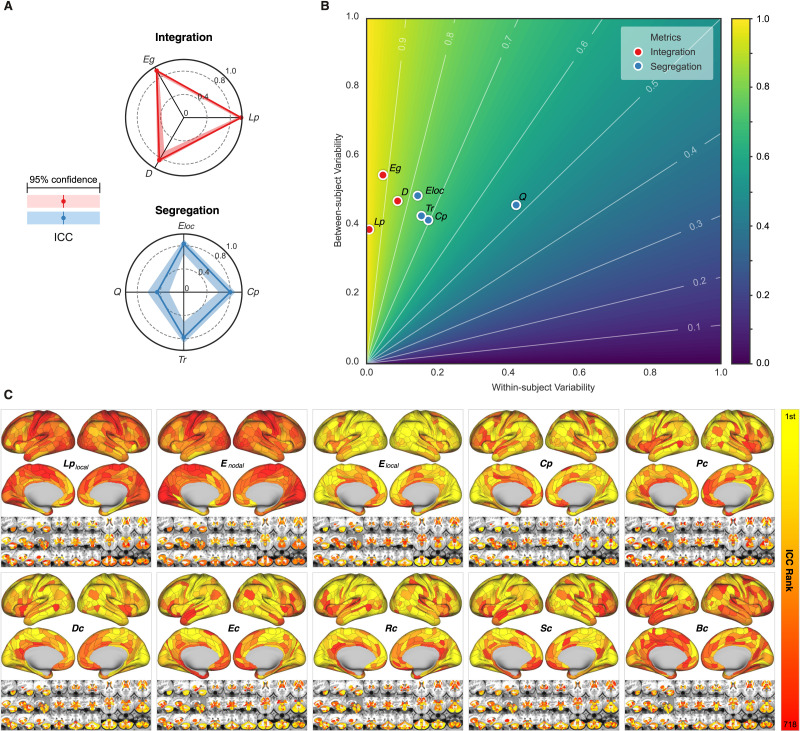
Figure 5. .
Measurement reliability and variability of global/nodal network metrics under the optimized pipeline. (A) Spider plots are visualized for ICCs (test-retest) with the 95% confidence intervals (CIs, shadow bands) for the global metrics of network integration, segregation. Integrative measures include average shortest path length (Lp), global efficiency (Eg), and pseudo diameter (D). Segregation measures include clustering coefficient (Cp), local efficiency (Eloc), transitivity (Tr), and modularity (Q). (B) The reliability anatomy was plotted as a function of between-subject variability (Vb) and within-subject variability (Vw). (C) Ranks of ICCs across the 360 cortical parcels and the 358 subcortical parcels in the optimal pipeline (wbCABP-718, slow-2, pos, OMST) are depicted. Ten nodal metrics are assessed including local characteristic path length of node (Lplocal), nodal efficiency (Enodal), local efficiency of nodes (Elocal), nodal clustering coefficient (Cp), pagerank centrality (Pc), degree centrality (Dc), eigenvector centrality (Ec), resolvent centrality (Rc), subgraph centrality (Sc), and betweeness centrality (Bc).

