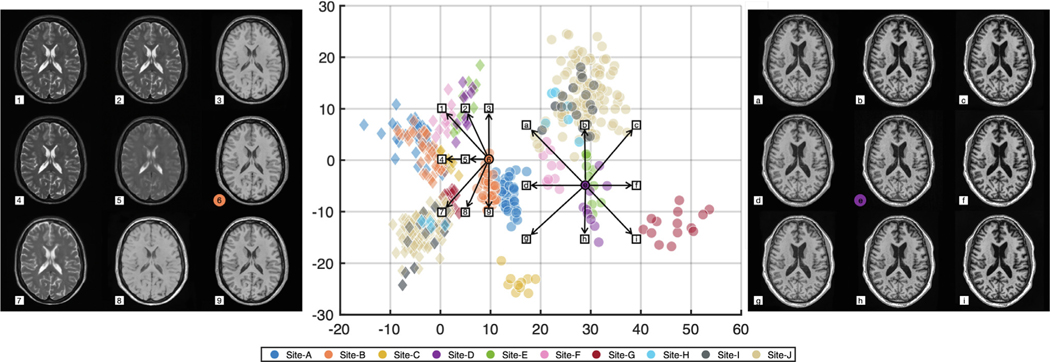
Fig. 9.
Interpolation in space and the corresponding synthetic images. On the left, is calculated from the orange circle and nine different values are fed into the decoder to generate the corresponding synthetic images, highlighting the transition area between and ’s. In the center we display our 2D space, in which circles indicate ’s for images and diamonds indicate ’s for images, and colors correspond to sites. On the right, a is calculated from the center circle and nine different values are fed into the decoder to generate corresponding synthetic images. Synthetic images and the corresponding values are matched either by numerical (left sub-panel) or alphabetical (right sub-panel) indexes.

