
Figure 2.
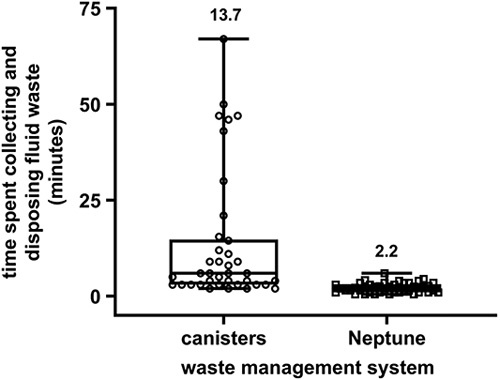
OR staff time spent collecting and disposing of surgical fluid waste. Distribution of the combined time spent collecting fluid waste intraoperatively (including adjusting suction levels, changing canister liners or Neptune manifolds, and suctioning fluids from the floor or other containers at the end of the procedure) and disposing of waste postoperatively (in minutes); data distributions are significantly different between canister (n=38) and Neptune groups (n=42, P<0.001). Individual data points are shown overlaid with a box plot (quartile 1, median, and quartile 3) and max/min whiskers. Numbers above bars represent average mean. P-values are generated from Wilcoxon Rank Sum Tests due to non-normal data distributions.