
Figure 3.
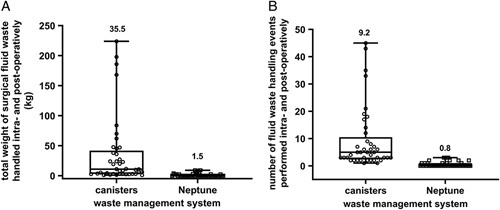
Staff ergonomics during use of surgical waste management systems. (A) Distribution of the total weight of surgical fluid waste (in kg) handled by OR staff during procedures utilizing canisters versus Neptune (P<0.001). (B) There was a similar decrease in the total number of handling events required during and after surgical procedures when Neptune was used compared to canisters (P<0.001). Individual data points are shown overlaid with a box plot (quartile 1, median, and quartile 3) and max/min whiskers. Numbers above bars represent average mean. P-values are generated from Wilcoxon Rank Sum Tests due to non-normal data distributions.