. 2023 Jun 20;54(3):996–1019. doi: 10.1044/2023_LSHSS-22-00149

Figure 3.

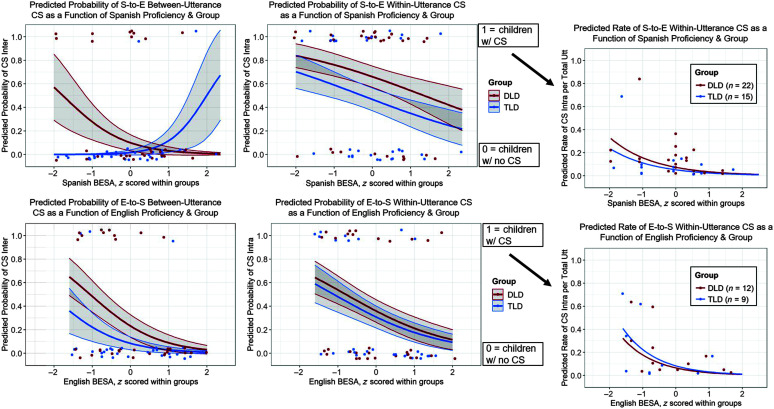
6 graphs. In all the graphs, red points correspond to Developmental Language Disorder and blue points correspond to Typical Language Development. For the graphs in the left and middle columns depicting results of the logistic regression, points with a y-value of 0 represent children who did not exhibit code-switching and points with a y-value of 1 represent children who did exhibit code-switching. The title of the first graph is Predicted Probability of Spanish to English between Utterance Code Switching as a function of Spanish Proficiency and group. The y axis is labeled Predicted probability of Code Switching inter and it ranges from 0.0 to 1.0 in increments of 0.2. The x axis is labeled Spanish BESA, z scored within groups and it ranges from negative 2 to 2 in unit increments. The red curve fitted to the red points starts at (negative 2, 0.55), goes down, passes through the points (negative 1, 0.29), (0, 0.1), (1, 0.05), and ends at (2, 0). A shaded boundary around the red curve has a height of 0.56 when the x value is negative 2 and a height of 0.03 when the x value is 2. The blue curve fitted to the blue points starts at (negative 2, 0), goes to the right till (negative 1, 0), goes up, passes through (0, 0.02), (1, 0.1), and (2, 0.5). The shaded region around the curve has a height of 0 for a x value of negative 2 and a height of 1.2 for a x value of 2. The title of the second graph is Predicted Probability of Spanish to English within utterance Code Switching as a Function of Spanish Proficiency and Group. The y axis is labeled Predicted Probability of Code Switching Intra and it ranges from 0.0 to 1.0 in increments of 0.2. The x axis is labeled Spanish BESA, z scored within groups and it ranges from negative 2 to 2 in unit increments. The red curve starts at (negative 2, 0.85), passes through points (negative 1, 0.75), (0, 0.65), (1, 0.55), and (2, 0.4). The shaded region around the red curve has a height of 0.2 when the x value is negative 2, and a height of 0.35 when the x value is 2. The blue curve passes through points (negative 2, 0.7), (negative 1, 0.6), (0, 0.45), (1, 0.35), and (2, 0.25). The shaded region around the blue curve has a height of 0.3 when the x value is negative 2 and a height of 0.26 when the x value is 2. An arrow points from the second graph to the third graph. The title of the third graph is Predicted rate of Spanish to English within utterance Code Switching as a Function of Spanish Proficiency and Group. The y axis is labeled Predicted Rate of C S Intra per Total Utterances and it ranges from 0.0 to 1.0 in increments of 0.2. The x axis is labeled Spanish BESA, z scored within groups and it ranges from negative 2 to 2 in unit increments. Red and Blue curves are plotted. The red curve represents the 22 participants with Developmental Language Disorder who engaged in within-utterance code-switching from Spanish to English. The blue curve represents the 15 participants with Typical Language Development who engaged in within-utterance code-switching from Spanish to English. The red curve passes through points (negative 2, 0.32), (negative 1, 0.15), (0, 0.05), (1, 0.2), and (2, 0). The blue curve passes through points (negative 2, 0.22), (negative 1, 0.1), (0, 0.05), (1, 0.02), and (2, 0). The title of the fourth graph is Predicted Probability of English to Spanish Between Utterance Code Switching as a Function of English Proficiency and Group. The y axis is labeled Predicted Probability of Code Switching Inter and it ranges from 0.0 to 1.0 in increments of 0.2. The x axis is labeled English BESA, z scored within groups and it ranges from negative 2 to 2 in unit increments. The red curve starts at (negative 1.5, 0.64), passes through points (negative 1, 0.5), (0, 0.25), (1, 0.1), and ends at (2, 0.05). The height of the shaded region around the red curve is 0.3 when the x value is negative 1.5 and 0.04 when the x value is 2. The blue curve starts at (negative 1.5, 0.35), (negative 1, 0.22), (0, 0.05), (1, 0), and (2, 0). The height of the shaded region around the blue curve is 0.39 when the x value is negative 1.5 and 0.02 when the x value is 2. The title of the fifth graph is Predicted Probability of English to Spanish within utterance Code Switching as a function of English Proficiency and Group. The y axis is labeled Predicted Probability of Code Switching Intra and it ranges from 0.0 to 1.0 in increments of 0.2. The x axis is labeled English BESA, z scored within groups and it ranges from negative 2 to 2 in unit increments. The red curve starts at (negative 1.5, 0.65), passes through points (negative 1, 0.53), (0, 0.35), (1, 0.2), and (2, 0.12). The height of the shaded region around the red curve is 0.28 when the x value is negative 1.5 and 0.18 when the x value is 2. The blue curve passes through points (negative 1.5, 0.59), (negative 1, 0.45), (0, 0.3), (1, 0.18), and (2, 0.1). The height of the shaded region around the blue curve is 0.33 when the x value is negative 1.5 and 0.16 when the x value is 2. The title of the sixth graph is Predicted Rate of English to Spanish Within Utterance Code Selection as a Function of English Proficiency and Group. An arrow points from the fifth graph to the sixth graph. The y axis is labeled Predicted Rate of Code Switching Intra per Total Utterances and it ranges from 0.0 to 1.0 in increments of 0.2. The x axis is labeled English BESA, z scored within groups and it ranges from negative 2 to 2 in unit increments. The red curve represents the 12 participants with Developmental Language Disorder who exhibited within-utterance code-switching from English to Spanish. The blue curve represents the 9 participants with Typical Language Development who exhibited within-utterance code-switching from English to Spanish.. The red curve passes through points (negative 1.5, 0.3), (negative 1, 0.18), (0, 0.06), (1, 0.01), and (2, 0). The blue curve passes through points (negative 1.5, 0.4), (negative 1, 0.22), (0, 0.03), and (2, 0). All values are estimated.

Model plots showing the relationship between proficiency in the target language and the predicted probability of engaging in between-utterance (left) and within-utterance (middle) code-switching (CS) during Spanish samples (top) and English samples (bottom) for children with DLD (red) versus children with TLD (blue), as well as the predicted rate of within-utterance CS among children who do switch (right). Plots were generated using the ggplot2 package (Version 3.3.6; Wickham, 2016). Left and middle: These model plots are based on predicted values from the logistic regression models estimated using target-language Bilingual English-Spanish Assessment (BESA) scores from the original sample and fixing covariates (age, BESA scores in the nontarget language) at their mean. The gray ribbons show one standard error within the model predictions. The dots show raw participant data indicating children who do (value of 1, along the top) and do not (value of 0, along the bottom) engage in CS as a function of their BESA scores. Right: The model plots in the right-hand column show the predicted rate of utterances containing within-utterance CS (per 50 utterances—a standard target for language samples) among those who do code-switch. The predicted values were generated from the count portion of the hurdle models using target-language BESA scores from the original sample, fixing covariates (age, BESA scores in the nontarget language) at their mean, and using 50 utterances as the total sample length. The predict() function for hurdle models did not generate standard errors along with the predicted values, and thus, there is no ribbon. The dots show raw participant data for the rate of utterances containing within-utterance CS per total utterances produced by the child as a function of BESA scores. S-to-E = Spanish to English; E-to-S = English to Spanish.