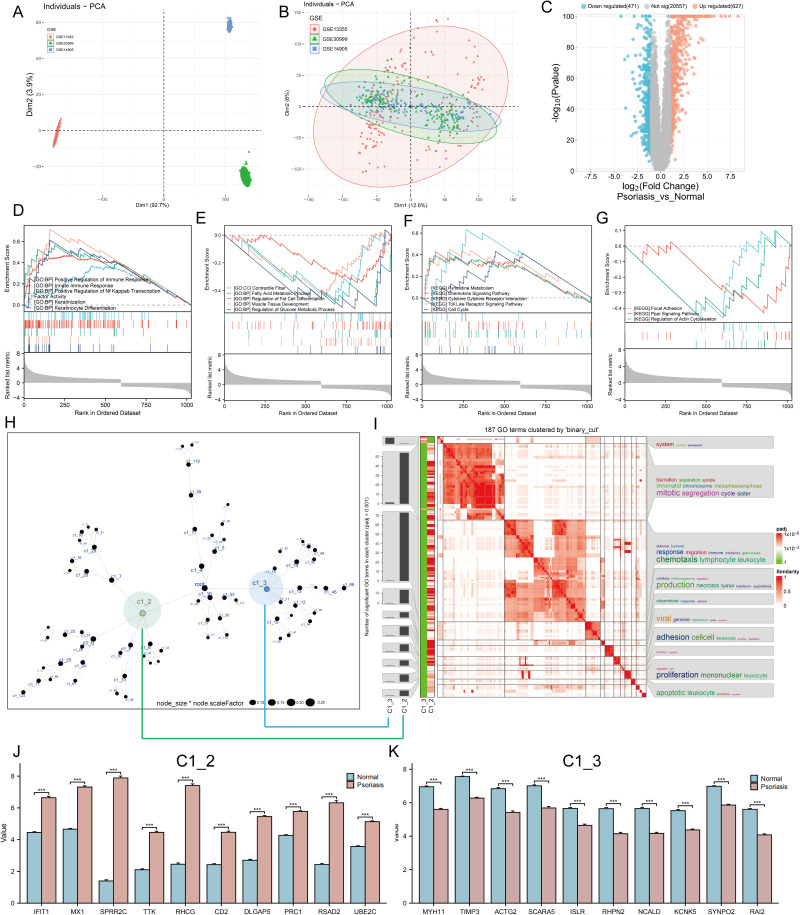
Figure 1.
Identification of molecular mechanisms associated with psoriasis. (A and B) Principal component analysis (PCA) shows the gene expression distribution in 3 psoriasis cohort samples (GSE13355, GSE30999, and GSE14905) before (A) and after (B) batch effect correction. (C) Volcano plots showing the DEGs between lesioned psoriasis samples and non-lesioned skin samples in merged cohort. Red dots represent genes that are upregulated in lesions, blue dots indicate genes that are downregulated in lesions, and gray dots represent genes for which the differences are not statistically significant. (D–G) (D and E) Up (D) and down (E)-regulated GO pathways in lesioned psoriasis samples. Different gene sets are represented with lines of unique color. Only gene sets with adjusted p < 0.05 and FDR q < 0.1 were considered significant. Several major gene sets are shown in the plot. (F and G) Up (F) and down (G)-regulated KEGGpathways in non-lesioned skin samples, similar to (D and E). (H) Co-expression network representing DEGs in the merged dataset . Each node represents a module, and the larger the node, the more genes the module contains. The merged dataset includes GSE13355, GSE30999, and GSE14905. See also Figure S1. (I) The signaling pathways involved in C1_2 (associated with (H) by green line) and C1_3 (associated with (H) by blue line) were enriched using the “simplifyEnrichment” package. On the left, a bar chart illustrates the extent to which various GO terms have been enriched within different modules, and a heat map shows the clustering of 287 GO terms in the middle, and important GO terms are summarized in the word cloud on the right. A redder color indicates a higher similarity between GO terms and a lower P-value. (J and K) Differential expression of hub genes of C1_2 (J) and C1_3 (K) between normal and psoriasis samples in merged cohort (Kruskal-Wallis test). Asterisk represents P-value (***P < 0.001).

