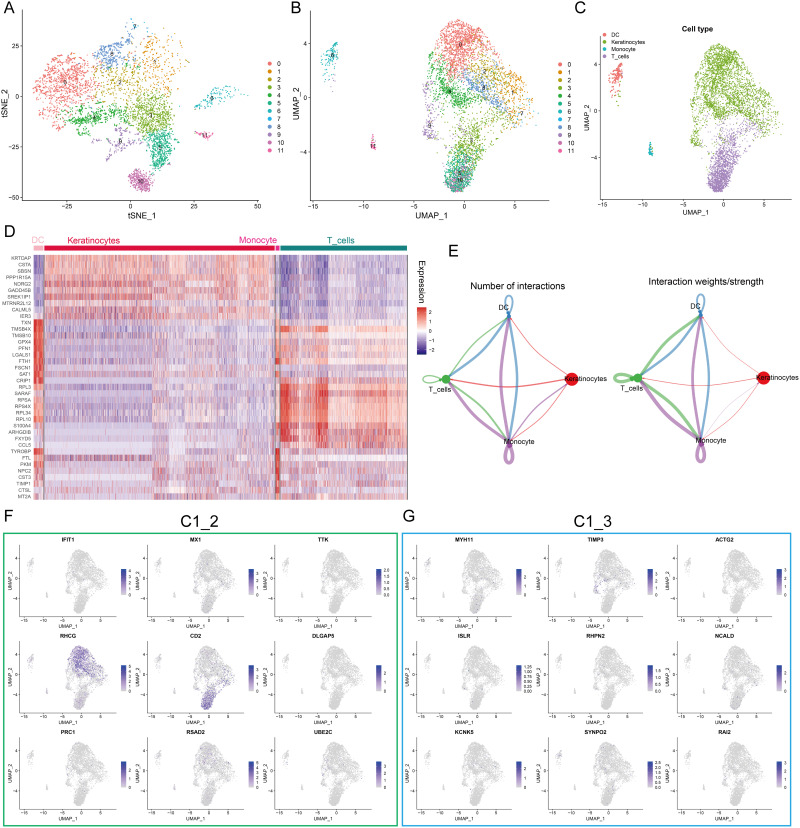
Figure 3.
Expression profiles of hub genes at the single cell level. (A and B) t-Distributed Stochastic Neighbor Embedding (tSNE) (A) and Uniform manifold approximation and projection (UMAP) (B) dimensionality reduction analysis. 12 unique cell clusters were identified with highly variable features. (C) 4 cell types were identified by singleR and unique gene markers. (D) Heatmap showing the expression patterns of 4 cell types in skin samples. (E) Circle plot showing number and weight of potential ligand-receptor pairs between cell types predicted by Cellchat. (F and G) UMAP revealing the expression hub genes of C1_2 (F) and C1_3 (G). Higher expression is indicated with a bluer color.

