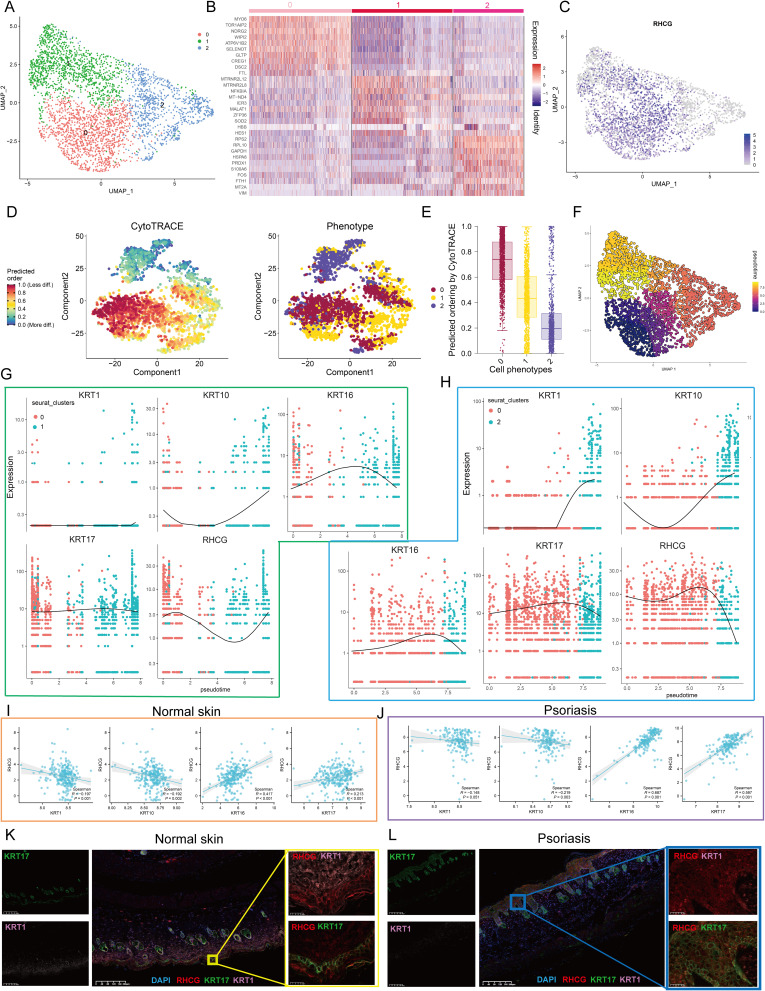
Figure 4.
Cell clusters of keratinocytes and potential transition between cell clusters. (A) UMAP plot of all keratinocytes, colourcoded for three molecular clusters. See also Figures S3–S6. (B) Heatmap showing the expression patterns of 3 cell clusters in keratinocytes. (C) UMAP revealing the expression level of RHCG. (D) tSNE demonstrating the degree of differentiation of each keratinocyte cluster assessed by CytoTRACE. (E) Box plot showing the differentiation score of each keratinocyte cluster. (F) Monocle 3 pseudotime analysis for all keratinocytes. (G and H) Jitter plots showing the expression level of KRT1/10/16/17 and RHCG changing with pseudotime from Cluster 0 to Cluster 1 (G) and Cluster 2 (H). (I and J) The scatter plot demonstrating the correlation between RHCG and KRT1/10/16/17 in normal (I) and psoriatic skin (J) in merged GEO cohort. Spearman method was conducted. (K and L) Double IF staining images of RHCG and KRT1 and KRT16 in the mice normal (K) and psoriasis (L) samples biopsy. Scale bar, 100 mM. The representative views of co-staining were shown in the enlarged images at right (scale bar, 20 mM).

