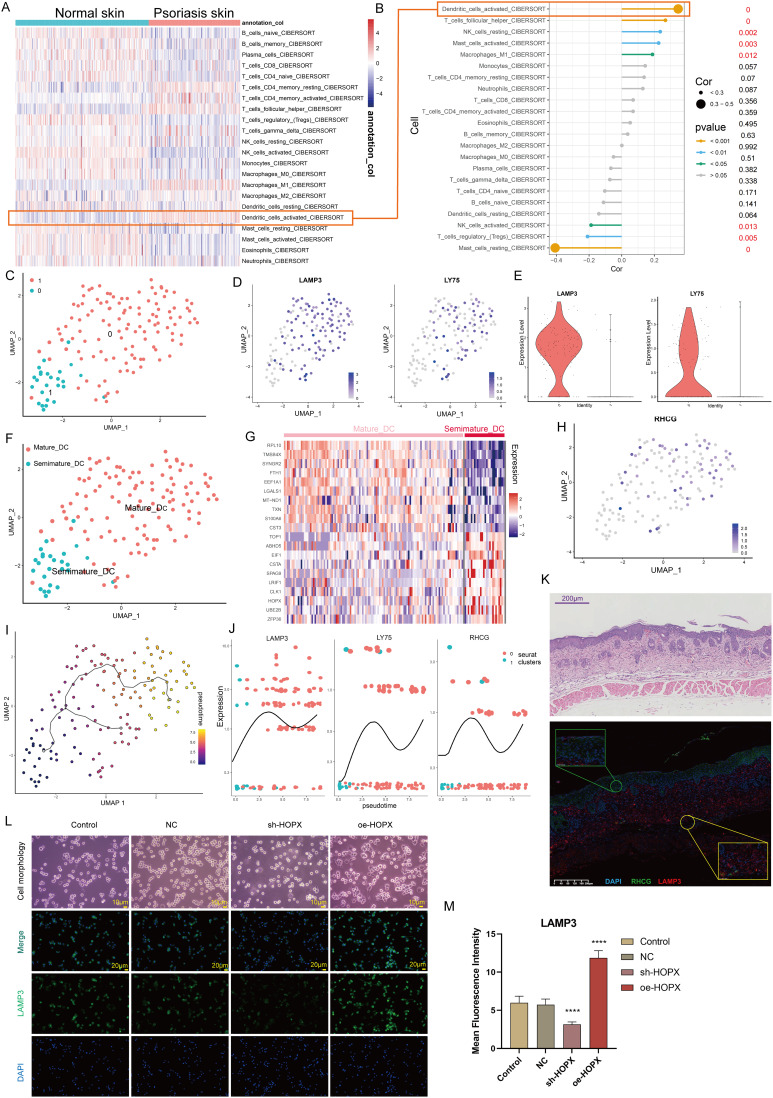
Figure 6.
Identification of the association of RHCG with mature dendritic (DC) cells. (A) Heatmaps of abundance differences of 24 immune infiltrating cells between normal and psoriatic skin (Cibersort method). (B) Bubble plot showing the correlation between RHCG and 24 immune cells (Related to (A) with a red line). The X-axis represents the correlation coefficient and the Y-axis represents the different immune cells. Different P-value intervals are represented by different colors, and the larger the correlation coefficient, the larger the bubble. (C) UMAP plot showing that the 2 subclusters’ DC cell populations were re-clustered into (color coding). See also Figure S9. (D and E) UMAP (D) and violin (E) plot revealing the expression level of mature DC cell markers (LAMP3 and LY75). (F) Two DC cell subpopulations were defined as semi-mature and mature DC cells, respectively. (G) Heatmap showing the expression patterns of semi-mature and mature DC cells. (H) UMAP plot revealing the expression level of RHCG in DC cells. (I) Monocle 3 pseudotime analysis for all DC cells. (J) Jitter plots showing the expression level of LAMP3, LY75 and RHCG changing with pseudotime from semi-mature DC cells to mature DC cells. (K) Double IF staining images of RHCG and LAMP3 in the psoriasis sample biopsy. Scale bar, 100 mM. The representative views of co-staining were shown in the enlarged images at right (scale bar, 20 mM). (L and M) IF staining for LAMP3 (green) demonstrating the role of HOPX in the regulation of DC cell maturation. The morphological images were also provided. One way ANOVA, ****p < 0.0001.

