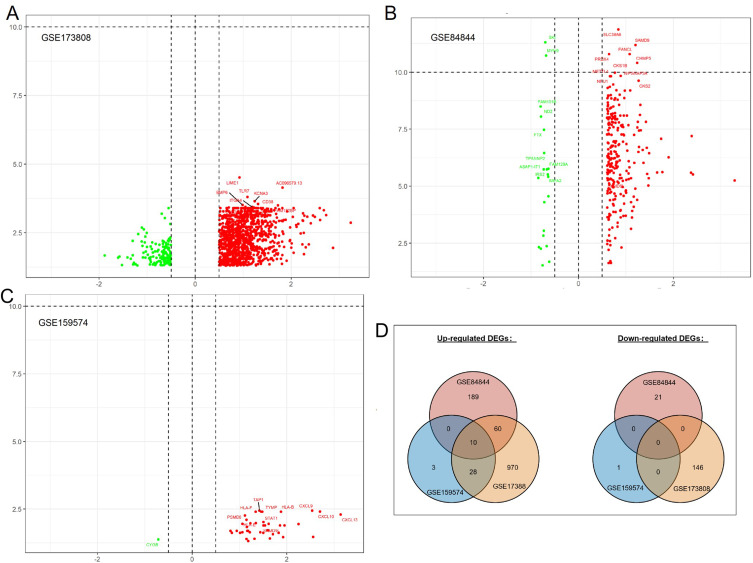
Figure 2.
Volcano plot showing the gene expression changes in pSS of different tissues: (A) DEGs of non-pSS vs pSS in RNA-seq of the minor salivary gland, (B) DEGs of pSS vs HC in RNA-seq data of whole blood cells, (C) DEGs of non-pSS vs pSS in RNA-seq of minor salivary glands, and (D) Venn diagram showing the common DEGs of the 3 datasets. (A–C): Green represents down-regulated, and red represents up-regulated genes.

