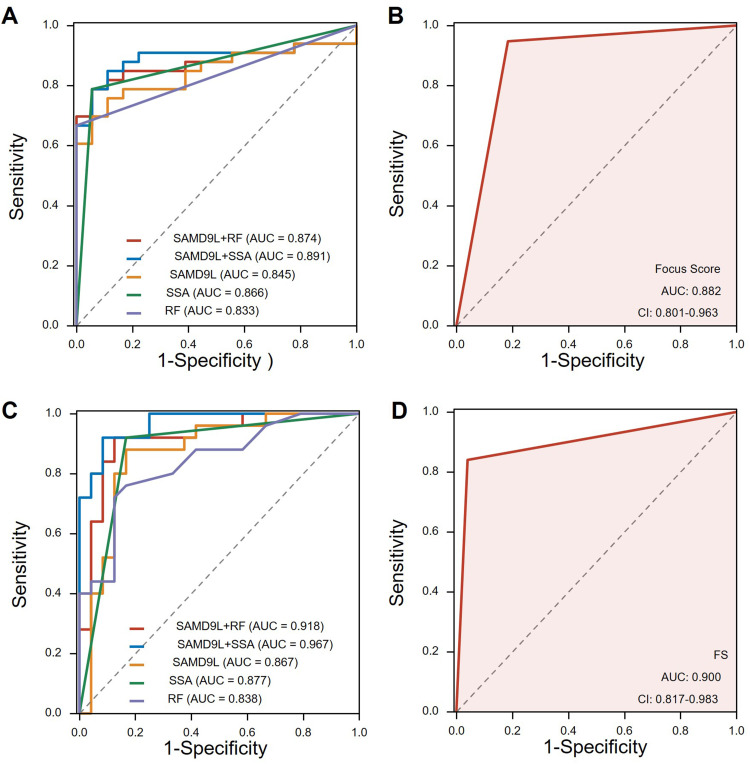
Figure 7.
Receiver operating characteristic curve of pSS prediction. (A) ROC curves using the SAMD9L gene expression level in MSG by the GEO data. (B) ROC curves according to whether the focus score >1 or not from GEO data. (C) ROC curves using the percentage of SAMD9L positive areas by our clinical data. (D) ROC curves drawn by focus score >1 or not using our clinical data.
Abbreviations: AUC, area under the curve; FS, focus score.

