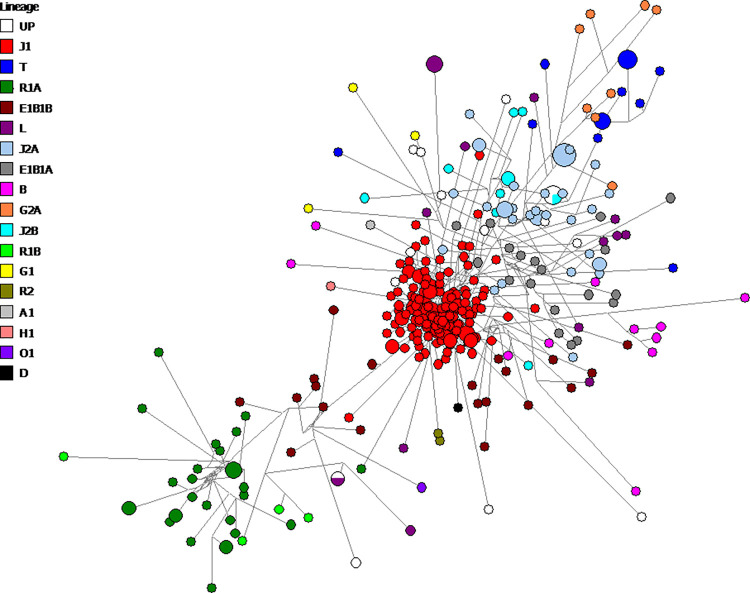
Fig 3. Median-joining network of Y-STR haplotypes for Qatari population distribution of predicted haplogroups.
Circles represent haplogroups, with an area proportional to sample size, and lines between them proportional to the number of mutational steps. Haplogroup categories represented in different colours are explained in the top left legend. The network’s major cluster haplogroups are assigned to J1 (48.5% of the total Qatari population). UP: unpredicted haplogroups.

