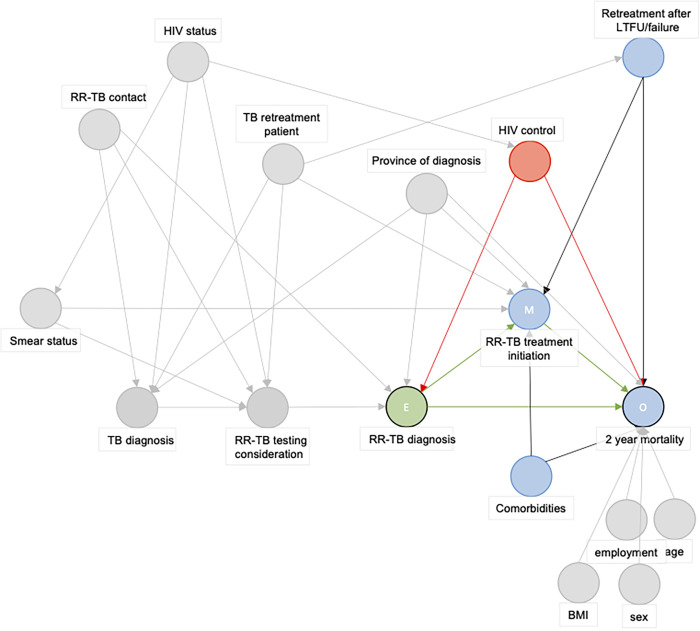
Fig 2. Directed Acyclic Graph used to identify the confounding paths of the exposure (RR-TB diagnosis by Xpert versus pre-Xpert targeted LPA-based RR-TB diagnostic algorithm)—outcome (two-year mortality) relationship.
Abbreviations: E: Exposure, HIV: Human immunideficiency virus, LTFU: Loss to follow-up, M: Mediator, O: Outcome, RR-TB: Rifampicin-resistant tuberculosis. The green circle represents the exposure, blue circles represent (ancestors of) the outcome. Red circles are ancestral variables of both the exposure and the outcome and is a confounder in the exposure-outcome relationship. Grey circles are variables not of importance in this exposure-outcome relationship. Green paths are causal pathways, red paths are biasing pathways.

