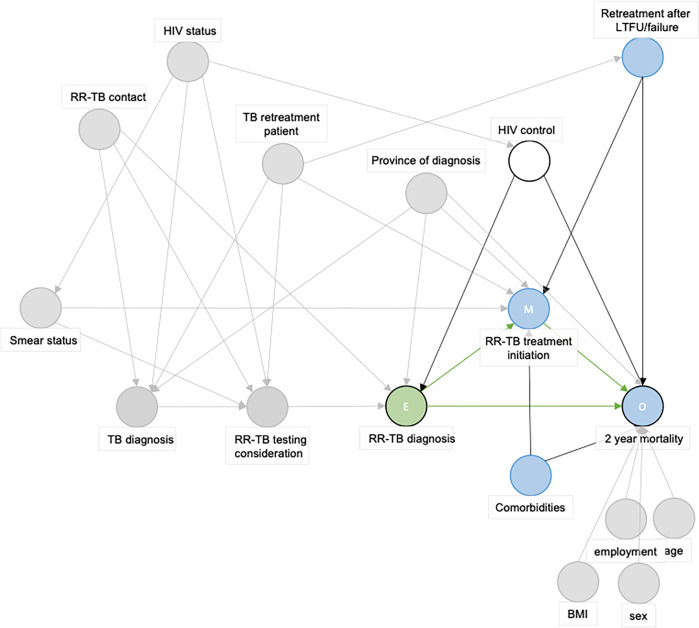
Fig 3. Directed Acyclic Graph used to guide the margninal structural model (MSM) assessing the (total) effect of the exposure (RR-TB diagnosis by Xpert versus pre-Xpert targeted LPA-based RR-TB diagnostic algorithm) on the outcome (two-year mortality) relationship.
Abbreviations: E: Exposure, HIV: Human immunideficiency virus, LTFU: Loss to follow-up, M: Mediator, O: Outcome, RR-TB: Rifampicin-resistant tuberculosis. The green circle represents the exposure, blue circles represent (ancestors of) the outcome. White cirkle represents an adjusted variable. Grey circles are variables not of importance in this exposure-outcome relationship. Green paths are causal pathways, red paths are biasing pathways.

